Jmeter series (38)-Detailed performance monitoring tool nmon
If you want to learn Jmeter from scratch, you can check out this series of articles
https://www.cnblogs.com/poloyy/category/1746599.html
Preface##
- For performance testing, server monitoring is essential. I also talked about monitoring servers through ServerAgent.
- This blog post will explain the nmon monitoring tool in detail
nmon official introduction##
- Nmon is a monitoring and analysis tool widely used on AIX and various Linux operating systems
- It can real-time capture the usage of system resources during system operation, and the recorded information is more comprehensive
- It can collect the server system resource consumption and output a specific file, and can use the excel analysis tool (nmon analyser) for statistical analysis of the data
Data types that can be monitored by nmon##
- CPU usage
- Memory usage
- Disk adapter
- Free space in the file system
- Page space and page speed
- Asynchronous I/O, only applicable to AIX
- Network File System (NFS)
- Disk I/O speed, transfer and read/write ratio
- Server details and resources
- Kernel statistics
- Process that consumes the most resources
- Run queue information
Features of nmon##
- Nmon running ** will not occupy too much** system resources, under normal circumstances ** CPU utilization ** will not exceed 2%
- Powerful functions, comprehensive monitoring data types
- Combined with meter diagrams such as grafana, the monitored data can be displayed more intuitively in real time
- Good portability and compatibility
- Unattended monitoring
- You can view the monitoring results in real time, or you can view the monitoring results locally after the test is over
Disadvantages of nmon when doing performance testing##
Can not be integrated into Jmeter like ServerAgent to view monitoring results
Install and run nmon under Linux
Check the installation environment###
# View operating system information
uname -a

# View linux release version
lsb_release -a

Download nmon
method one####
Official address: http://nmon.sourceforge.net/pmwiki.php?n=Site.Download

Upload to the server directory via FTP
Way two####
The server directly hits the command line
wget http://sourceforge.net/projects/nmon/files/nmon16e_mpginc.tar.gz
The latest version cannot be downloaded in this way
Baidu cloud download link
Contains nmon installation package and analysis data toolkit
Link: https://pan.baidu.com/s/1WHmlf-Em3FfKbUUa_GWi6A Extraction code: w6gy
Unzip###
tar -zxvf nmon16m_helpsystems.tar.gz
View the unzipped file###

Run nmon
My system is x86_64 centos8, knock
. /nmon_x86_64_centos8
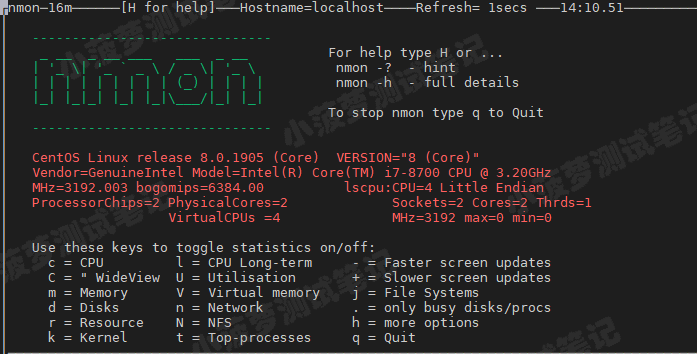
Commonly used nmon shortcut commands###
- q: stop and exit nmon
- h: View help
- c: View CPU statistics
- m: View memory statistics
- d: View hard disk statistics
- k: View kernel statistics
- n: View network statistics
- N: View NFS statistics
- j: View file system statistics
- t: View high-consumption processes
- V: View virtual memory statistics
- v: Verbose mode
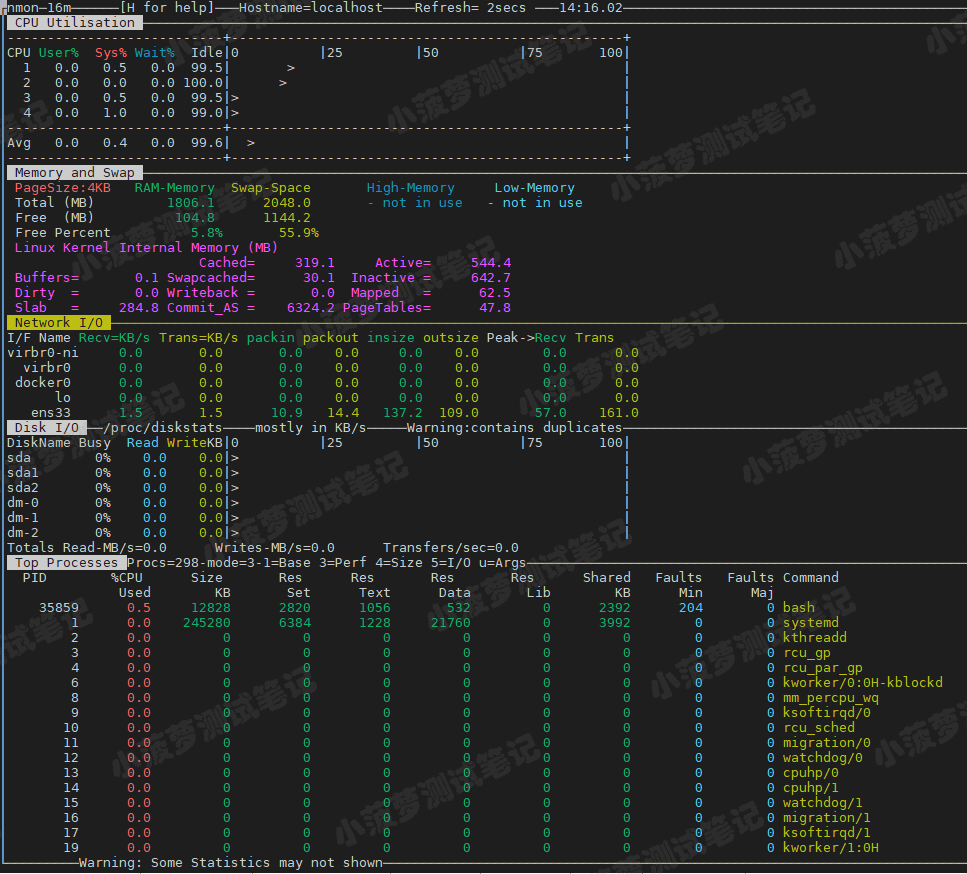
Press multiple shortcut commands to display multiple monitoring results at the same time
nmon command line parameters##
When starting nmon, you can also specify some parameters
| Parameters | Function |
|---|---|
| - f | The monitoring result is output as a file, default: machine name_date_time.nmon |
| - F | Same function as -f, but specify the output file name |
| - s | Sampling frequency, in seconds |
| - c | Sampling times |
| - m | nmon file save directory |
| - T | Display processes with high resource usage |
Command line chestnut####
. /nmon -f -t -s 10-c 6-m /data/nmon
Collect system resource data every 10s, 6 times in total (6 times in 1 min), and generate the final nmon file in the /data/nmon directory

Transfer this .nmon file to the local for subsequent result analysis
Focus
- Generally speaking, it is not recommended to use nmon monitoring for stability test (stress test), because when the generated nmon file exceeds 10M, the analysis tool will report an error due to insufficient memory
- If necessary, it is recommended to increase the sampling frequency and reduce the sampling frequency (less than 330 times)
View nmon monitoring results##
Introduction to nmon_analyser###
- nmon monitors the captured information, generally nmon_analyser is used for analysis
- nmon_analyser is provided by IBM, uses excel's macro command to analyze and load to generate excel charts, showing various information about resource usage
Download nmon_analyser
Official: http://nmon.sourceforge.net/pmwiki.php?n=Site.Nmon-Analyser
Baidu cloud link: https://pan.baidu.com/s/1WHmlf-Em3FfKbUUa_GWi6A Extraction code: w6gy
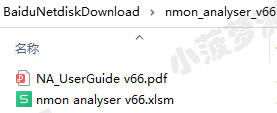
After decompression, there are two files
- psd: documentation
- xlsm: Macro file, analysis tool
Open nmon analyser v66.xlsm
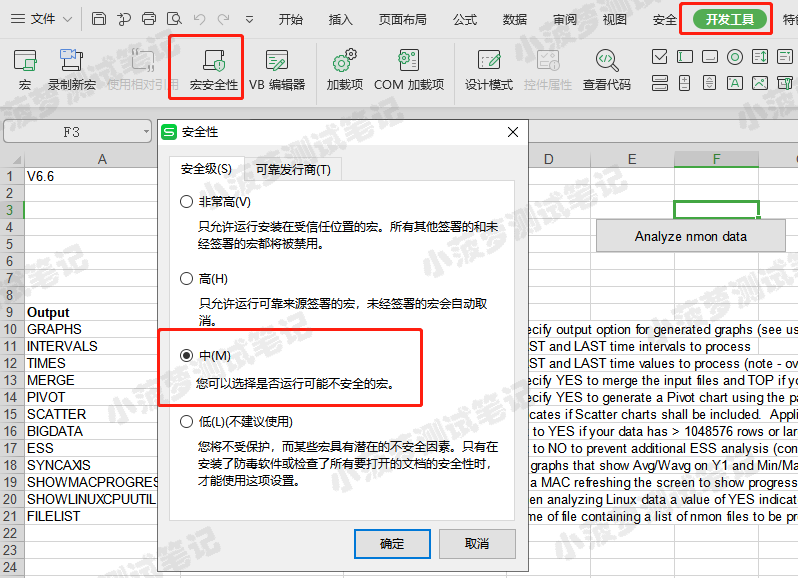
Remember to open it in excel through office or wps, and need to start the macro
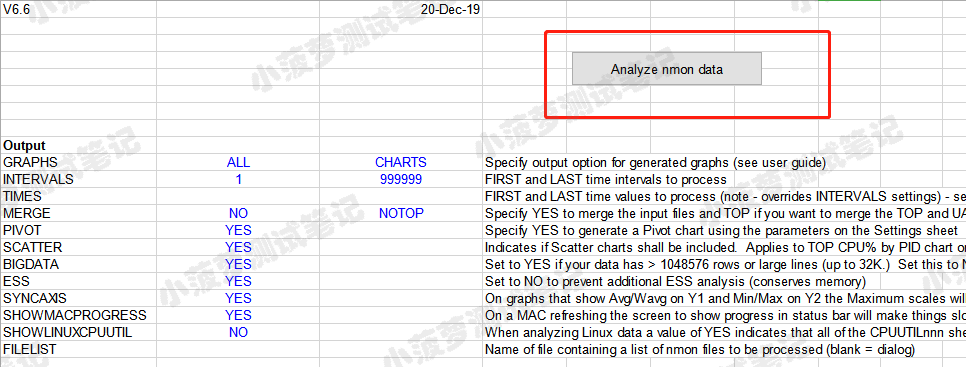
Resolve the failure of macro startup
Open .nmon file###
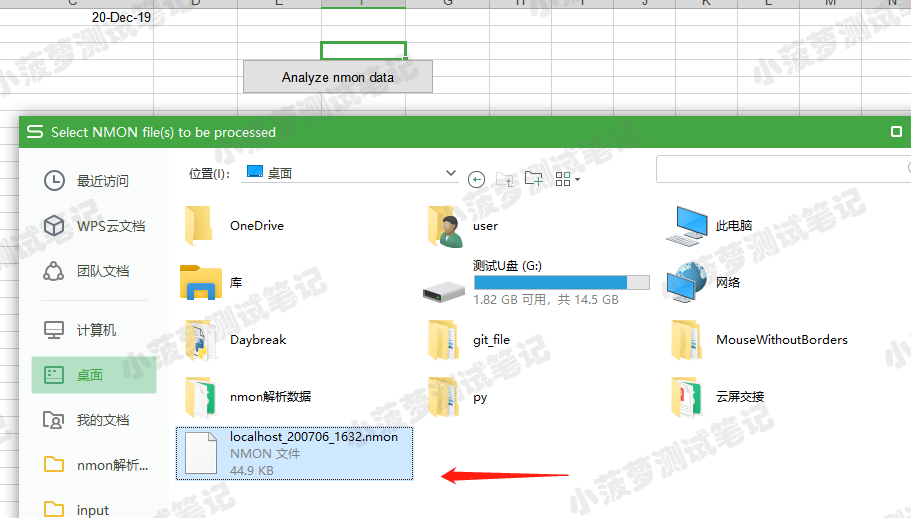
Click Analyze nmon data, select nmon file
View monitoring result data###
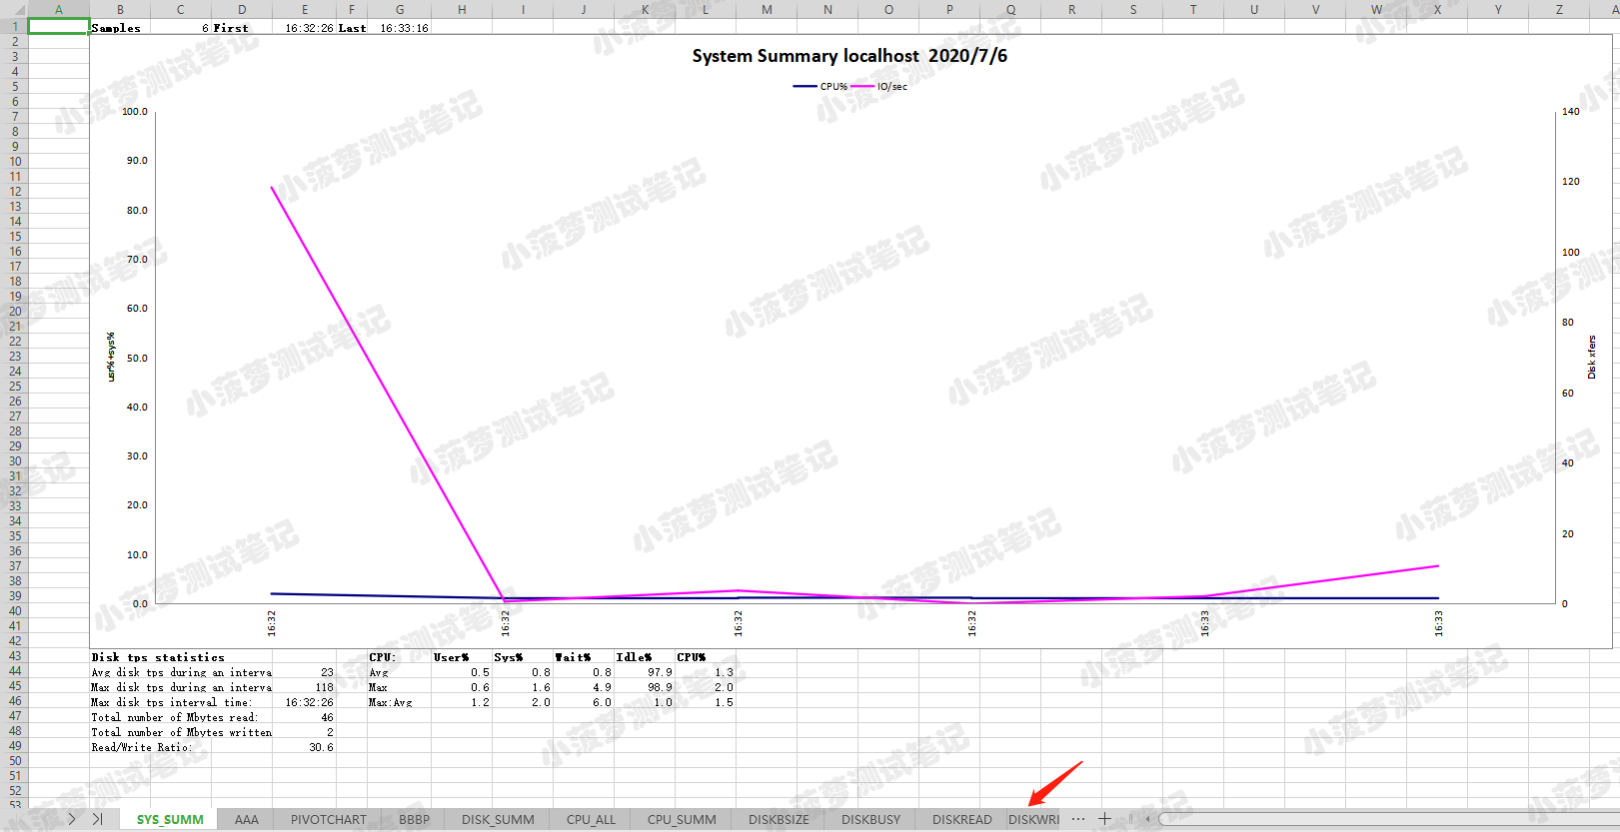
Graph analysis of nmon monitoring results##
The analysis result file is an excel table, which is divided into multiple tab pages such as SYS_SUMM, CPU_ALL, MEM, DISK_SUMM, etc. Each tab page has detailed data monitored under the topic and corresponding statistical charts
Each tab page displays detailed monitoring data for a certain indicator such as CPU, memory, network, and I/O
System summary interface: SYS_SUMM
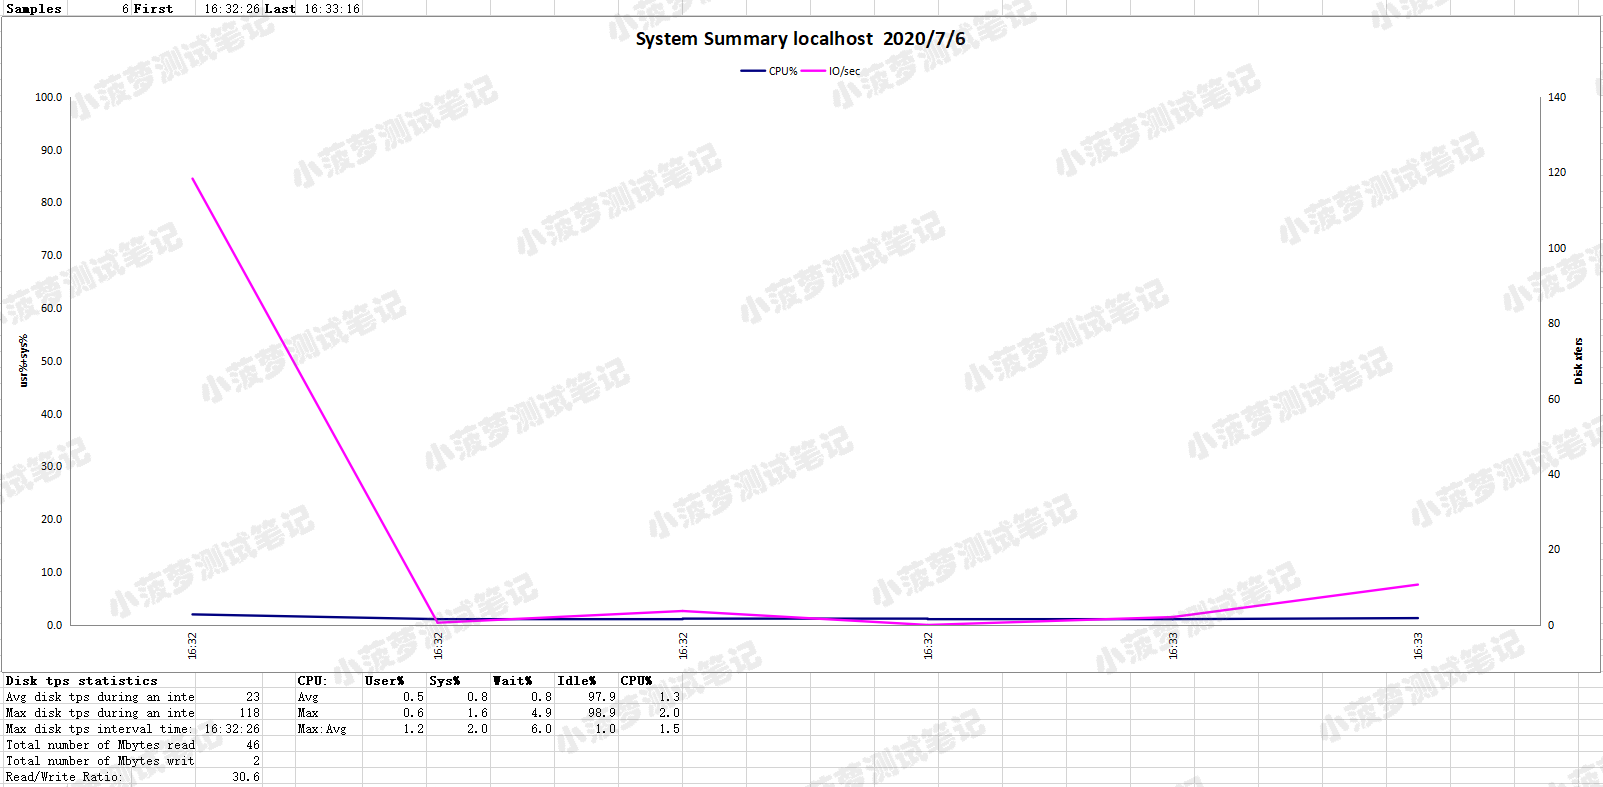
Page display items
- CPU name
- Execution date
- System cpu usage (blue line)
- System I/O situation (pink line)
- The left vertical axis is the system cpu (user%+sys%) utilization rate
- Horizontal axis is running time
- The right vertical axis is the system disk transfer (Disk xfers)
- The lower side of the coordinates is statistical information: system I/O situation (average value, maximum value, and time of maximum value in a collection interval), system CPU usage, etc.
| Parameters | Description |
|---|---|
| Avg disk tps during an interval | The average number of disk I/Os in the collection interval This value is equal to the average value of the IO/sec column in Sheet DISK_SUMM |
| Max disk tps during an interval | The maximum number of disk I/Os in the collection interval This value is equal to the maximum value of the IO/sec column in Sheet DISK_SUMM |
| Max disk tps interval time | Display the time point of the maximum disk I/O |
| Total number of Mbytes read | The total number of megabytes read from the disk in the acquisition interval |
| Total number of Mbytes written | Total number of Mbytes written to disk in the acquisition interval |
| Read/Write Ratio | |
| User% | Time percentage of all CPUs in User Mode in the acquisition interval (Avg, Max) |
| Sys% | Time percentage of all CPUs in System Mode in the acquisition interval (Avg, Max) |
| Wait% | The percentage of time that all CPUs are idle and waiting for I/O to complete in the collection interval (Avg, Max) |
| Idel% | The percentage of time that all CPUs are idle during the acquisition interval (Avg, Max) |
| CPU% | Total CPU usage (Avg, Max) |
Focus
- If a CPU is fully used, the CPU occupancy time ratio should be User% (65-70%), Sys% (30-35%), Idel% (0-5%)
- If the proportion of Sys% is too large, it means that the system process itself occupies most of the cpu resources. You can consider whether there are too many zombie processes in the system or the system process has an infinite loop.
- A large percentage of CPU Wait% indicates that there may be a bottleneck in IO or memory, which may be caused by frequent data exchange due to insufficient memory.
System Information: AAA
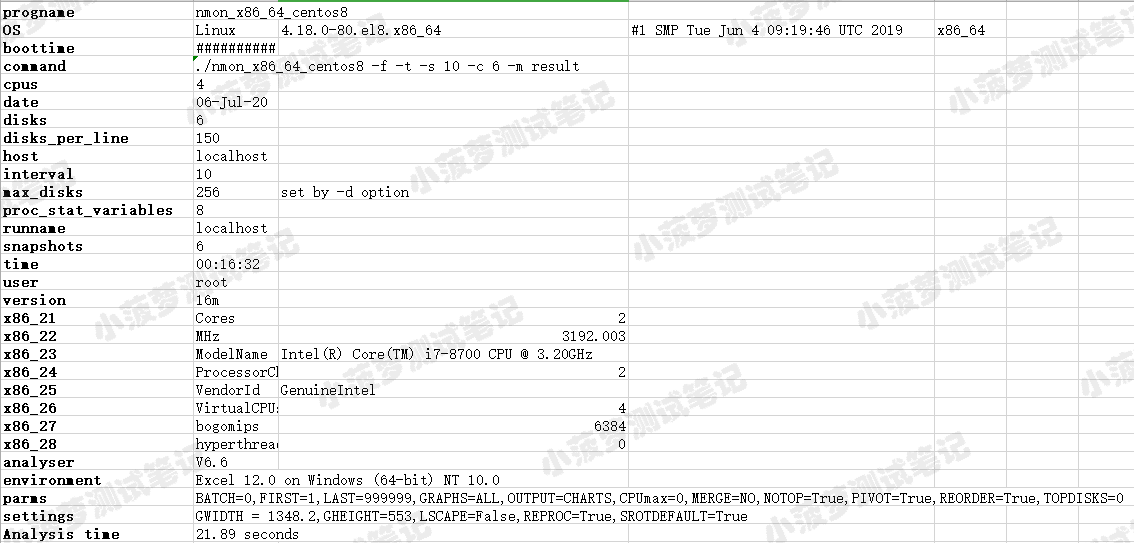
The information mainly includes: execute command, host CPU number, operating system kernel version information, host name and other information
System details: BBBP
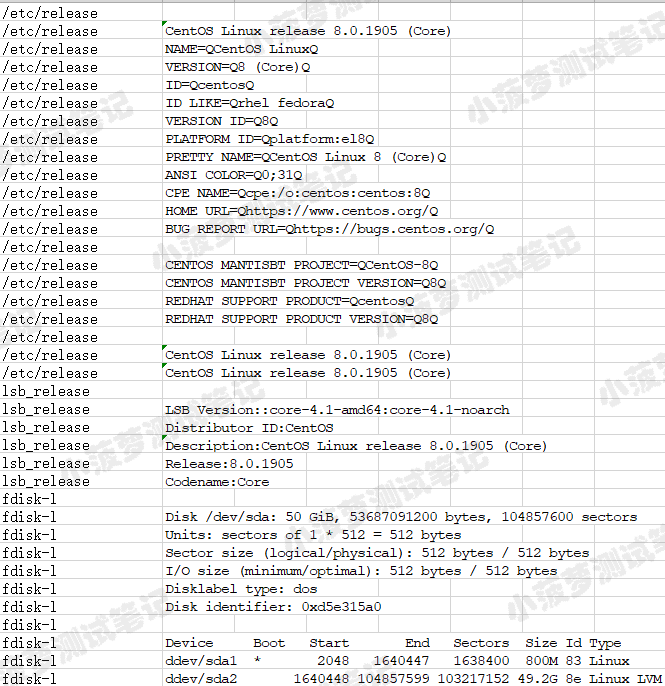
Page information mainly includes: operating system version, host disk information, host CPU model, main frequency information, memory information, network card information, etc.
CPU usage: CPU_ALL, CPU_SUMM, CPU001...
Including host CPU usage summary and the running status of each CPU.
Focus on the CPU_ALL page here
On the CPU_ALL page, you can see the overall CPU data at each monitoring point as shown in the figure below, including User%, Sys%, Wait%, Idle%, Steal%, CPU%, and CPUs (number of cpu) and corresponding charts
CPU-ALL
Parameter Description####
| Parameters | Description |
|---|---|
| CPU Total | Execution interval time list |
| User% | Time percentage of all CPUs in User Mode in the acquisition interval (Avg, Max) |
| Sys% | Time percentage of all CPUs in System Mode in the acquisition interval (Avg, Max) |
| Wait% | The percentage of time that all CPUs are idle and waiting for I/O to complete in the collection interval (Avg, Max) |
| Idel% | The percentage of the time that all CPUs are idle in the collection interval (Avg, Max). This value and the sum of User%, Sys%, Wait%, and Steal% are equal to 1 |
| CPU% | The overall CPU usage, this value is usually equal to User%+Sys% |
| CPUs | Number of CPU cores, that is, how many cores does the operating system have |
Disk read and write situation###
There are six tabs to view the disk status
- DISK_SUMM
- DISKBSIZE
- DISKBUSY
- DISKREAD
- DISKWRITE
- DISKXFER
Disk read, write and I/O statistics, read and write status of each disk partition of the system. Focus on DISK_SUMM here
DISK_SUMM
DISK_SUMM displays the Read/Write rate (KB/s) of all disks and partitions and the I/O rate of all disks and partitions according to the acquisition time.
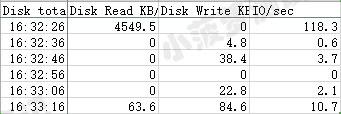
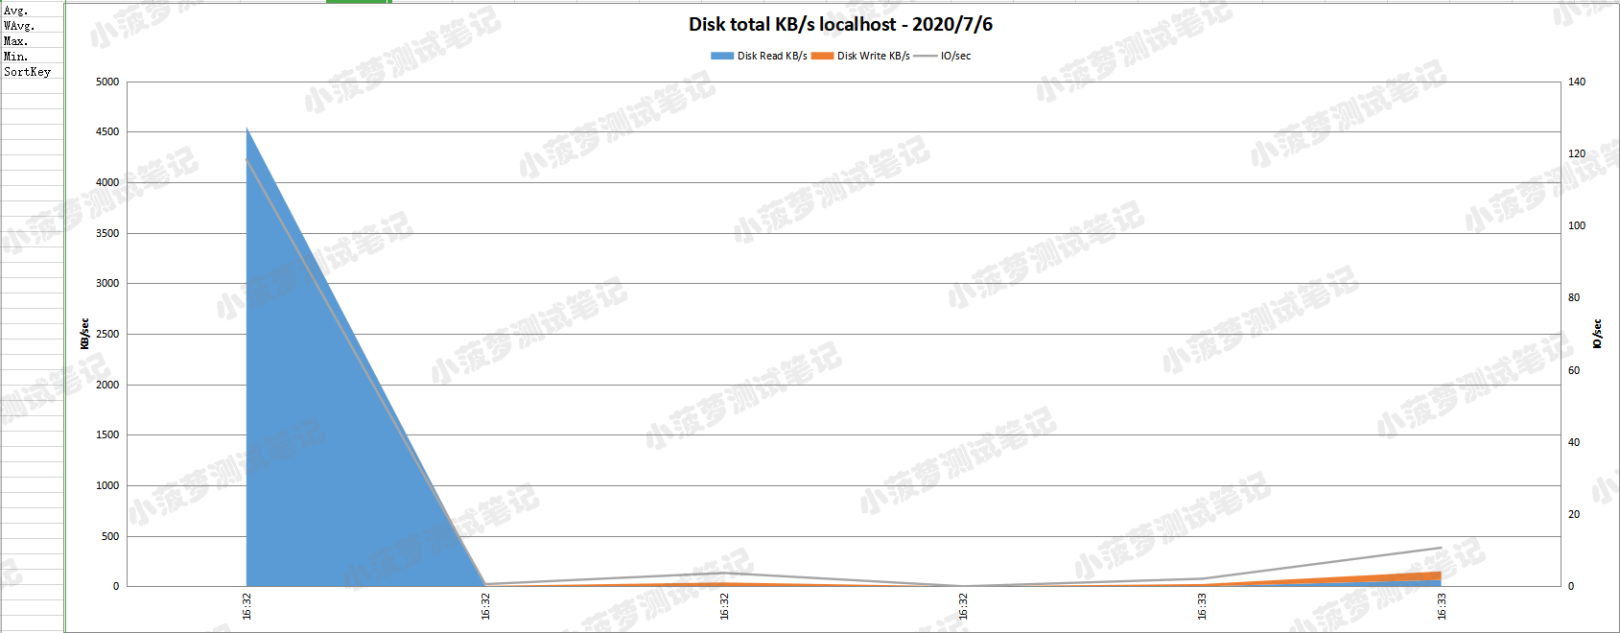
Parameter Description####
| Parameters | Description |
|---|---|
| Disk total KB/s | Execution interval time list |
| Disk Read KB/s | The read rate of the disk device in the acquisition interval |
| Disk Write KB/s | The write rate of the disk device in the acquisition interval |
| IO/sec | The overall average disk IO per second in the collection interval |
Memory situation: MEM
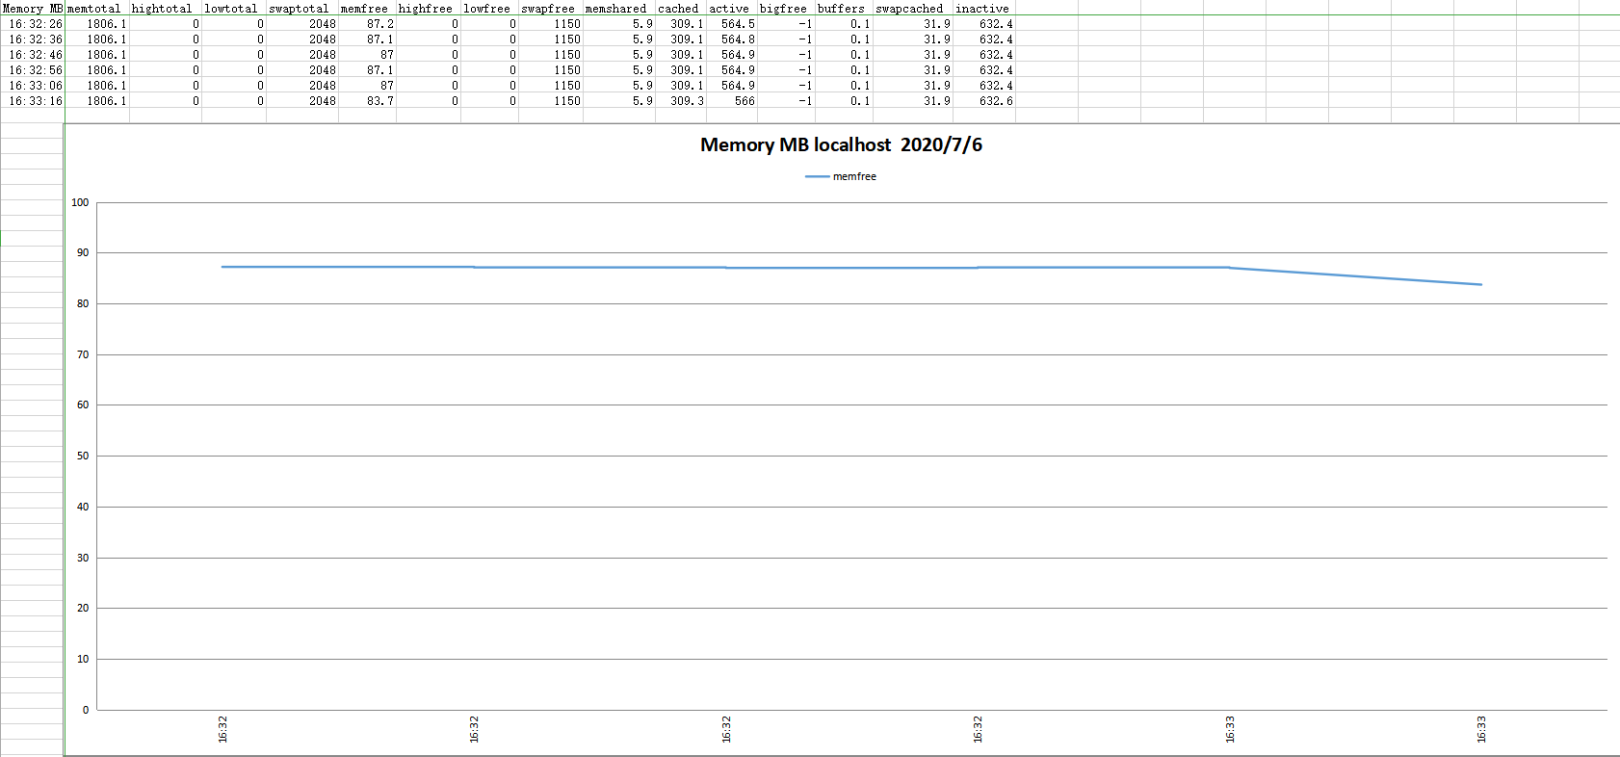
Parameter Description####
| Parameters | Description |
|---|---|
| memtotal | Total size of physical memory, in MB |
| swaptotal | The total size of virtual memory (ie swap space) |
| memfree | Remaining physical memory size |
| swapfree | Remaining virtual memory size |
| cached | Cache size occupied by cache in physical memory |
| active | Memory size in active use |
| buffers | The size of file system buffers |
| swapcached | The size of cache occupied by cache in virtual memory |
| inactive | Infrequently used memory size |
System network situation: NET, NETPACKET
Reflect the network operation of the system, the number of data packets read and written by each network adapter of the system
The NET page displays the data transfer rate of each network adapter in the system (kilobytes/second)

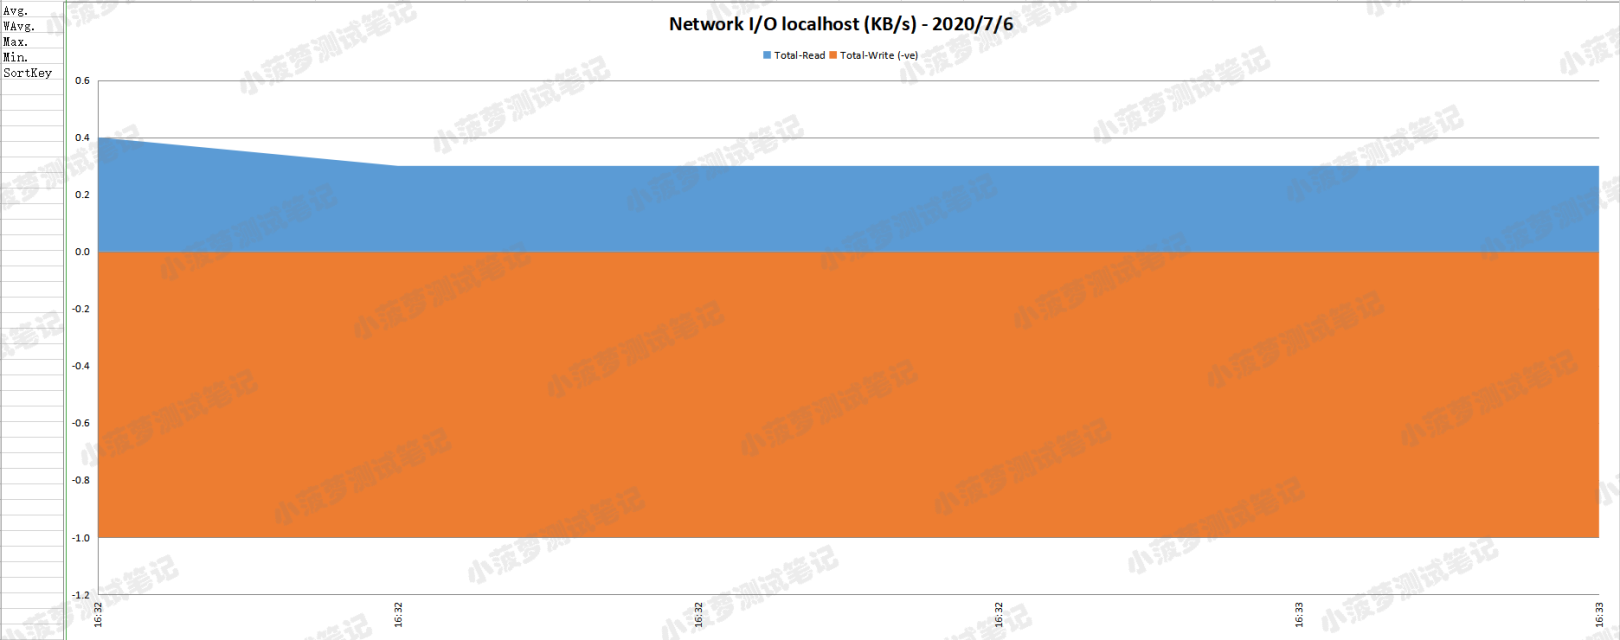
Parameter Description####
| Parameters | Description |
|---|---|
| Network I/O | Execution interval time list |
| Total-Read | The total size of data packets received by the network adapter per second (KB/s) |
| Total-Write(-ve) | The total size of data packets sent by the network adapter per second (KB/s) |
System process: PROC
Reflects the average number of running threads in the system and threads waiting to be switched
Collection time: ZZZZ
Record the time point when the nmon tool collects system information
Recommended Posts