python drawing | National Meteorological Administration open source forecast verification library (multi-map warning)
2020.07.23 National Meteorological Center Liu Couhua Senior Engineer introduced the whole-process inspection and evaluation system (Meteva). See the video for details (video source "happy scientific research", welcome to follow).
Meteva introduction
The Meteva library is developed by the Inspection Division of the National Meteorological Center's Forecast Technology Research and Development Office. It is an integration of functions and functions required for comprehensive inspection and evaluation of weather forecast products and intermediate products. It is the first Python program library dedicated to weather forecast verification in China.
At present, the program provides more than 200 functions that can be reused, and integrates basic functions (including data reading and writing, interpolation, accumulation, averaging, selection, grouping, etc.), inspection algorithms (including various types of Two-category, multi-category, continuous variable, probability forecast and ensemble forecast inspection, etc.) and inspection graphic products (including spatial comparison chart, time series comparison, error sequence analysis chart, error spatial distribution chart, etc.).
Prediction check
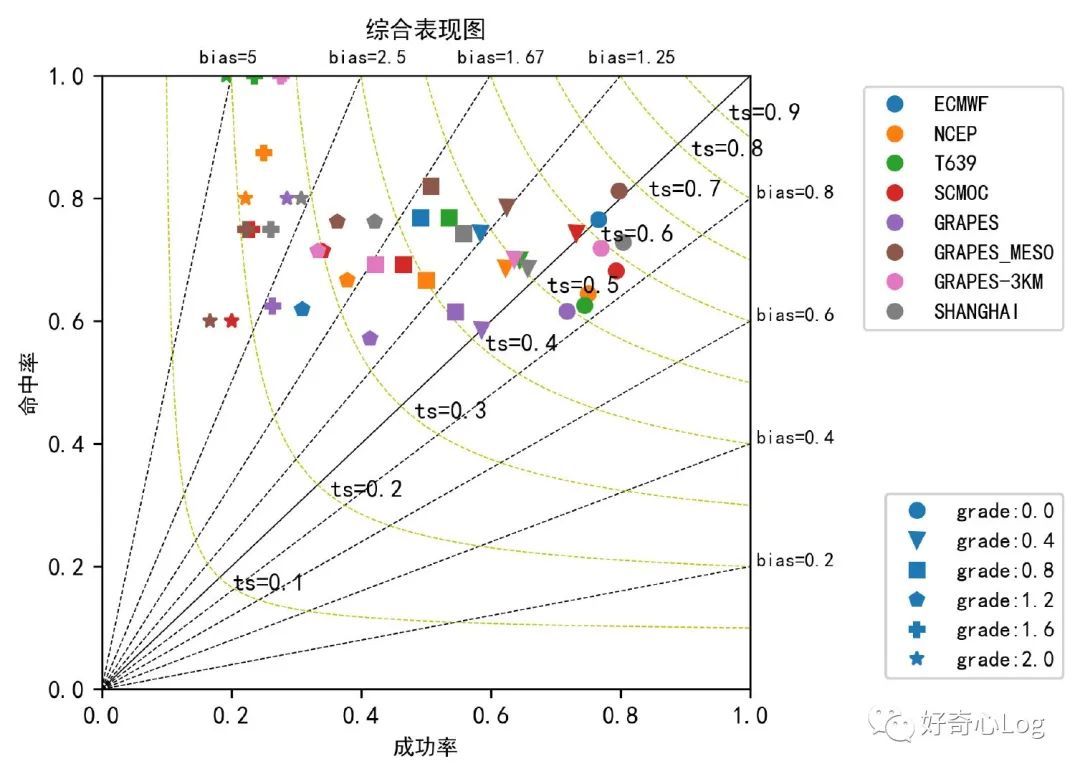
- Comprehensive inspection chart
performance()
Draw a comprehensive inspection map of the two-category forecast, the abscissa is the success rate, the ordinate is the hit rate, and the auxiliary lines of equal bias and equal ts curves are drawn, and the test results are displayed in the figure as dots, so that you can directly browse the success Test indicators such as rate, hit rate, bias and ts.
Multi-class forecast test
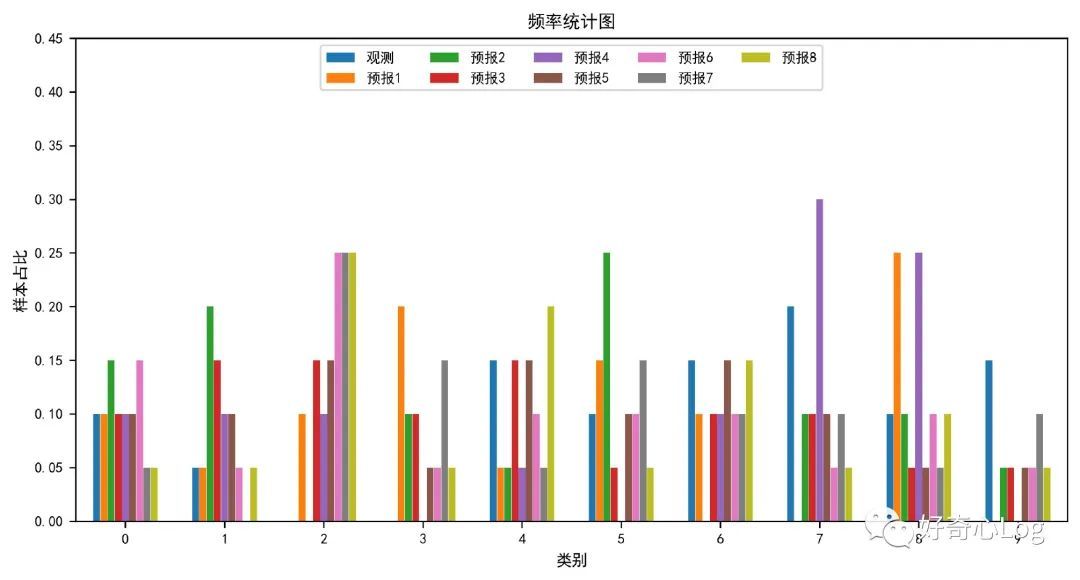
- Frequency statistics graph
frequency_histogram()
Statistical observations and forecasts are the number of samples in various categories, and are drawn into pictures in the form of histograms
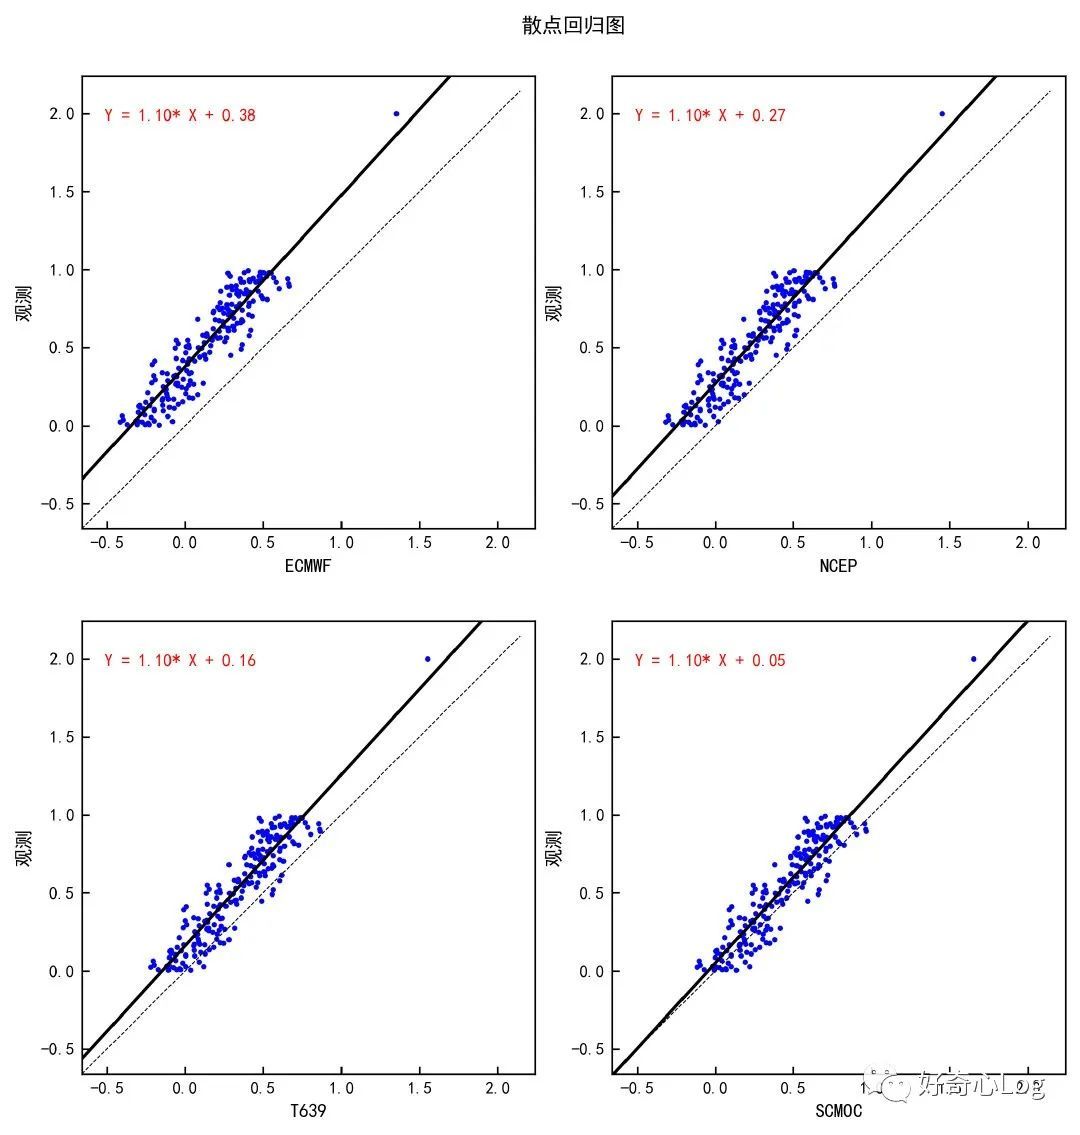
Continuous forecast test
- Scatter regression graph
scatter_regress()
Draw observation-forecast scatter plots and linear regression curves, the abscissa is the observation value, the ordinate is the forecast value, the value range of the abscissa and the ordinate are automatically set to be the same, and a reference line for perfect forecast is added in the middle of the graph.
-
Frequency graph
pdf_plot()
Sort the observed and predicted values from small to large respectively, and draw the two sets of data after sorting into a frequency matching relationship graph containing two subgraphs. The first sub-picture is a comparison diagram of the probability distribution functions of observations and forecasts, and the second sub-picture is a frequency matching mapping relationship diagram. The value ranges of the abscissa and ordinate in the figure are automatically set to be the same, and a reference line for perfect prediction is added in the middle of the graph. -
Frequency comparison box and whisker plot
box_plot_continue()
The frequency box and whisker diagrams for observation and forecast are drawn separately. The abscissa is "observation" and "forecast", and the ordinate is the data value. The box and whisker diagram contains the first quartile, median, and third quartile. Numbers and outliers (outliers) and other different levels.
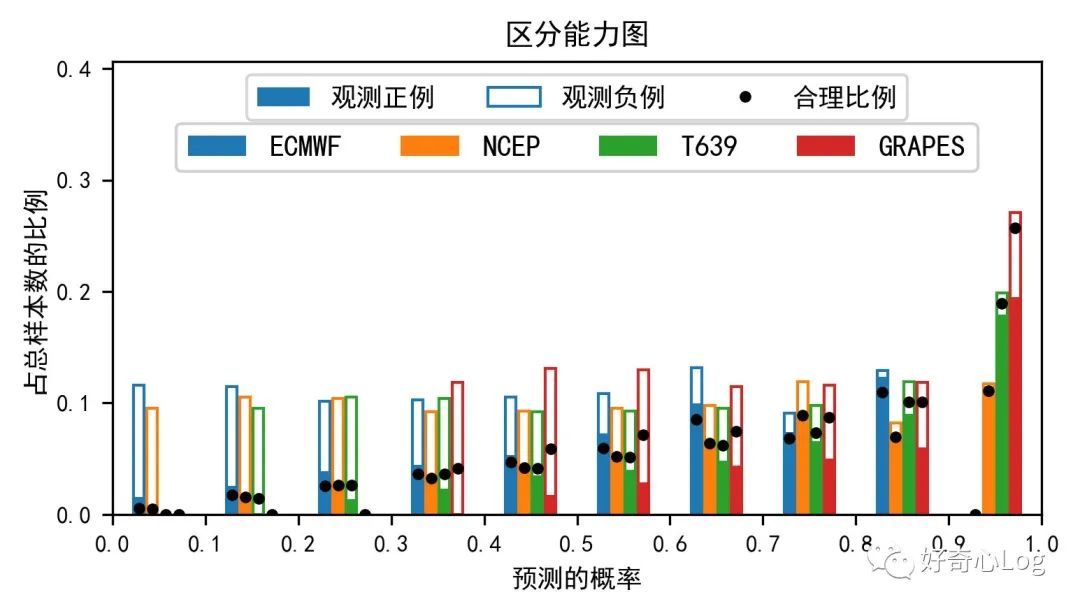
Probability Forecast Test
- Discrimination diagram
discrimination()
The forecast probability is plotted as the proportion of the samples with the occurrence and non-occurrence of observed sample events in different intervals to the total sample.
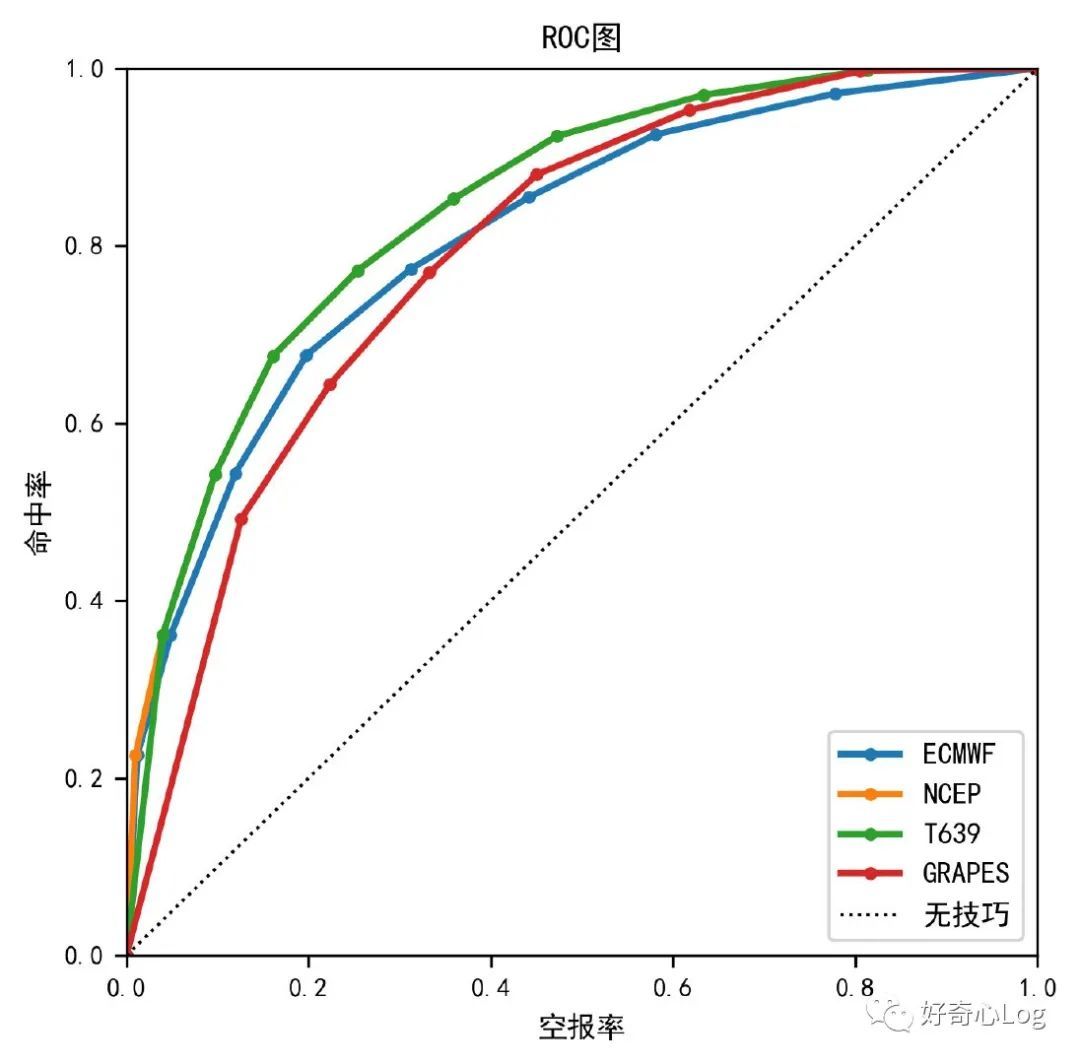
- ROC diagram
roc()
Plot the ROC curve, the curve uses the empty report rate (pofd) as the abscissa, and the hit rate (pod) as the ordinate. Among them, the curve trace points are the corresponding (null report rate, hit rate) under the condition that different thresholds are set for the forecast probability as the forecast occurrence.
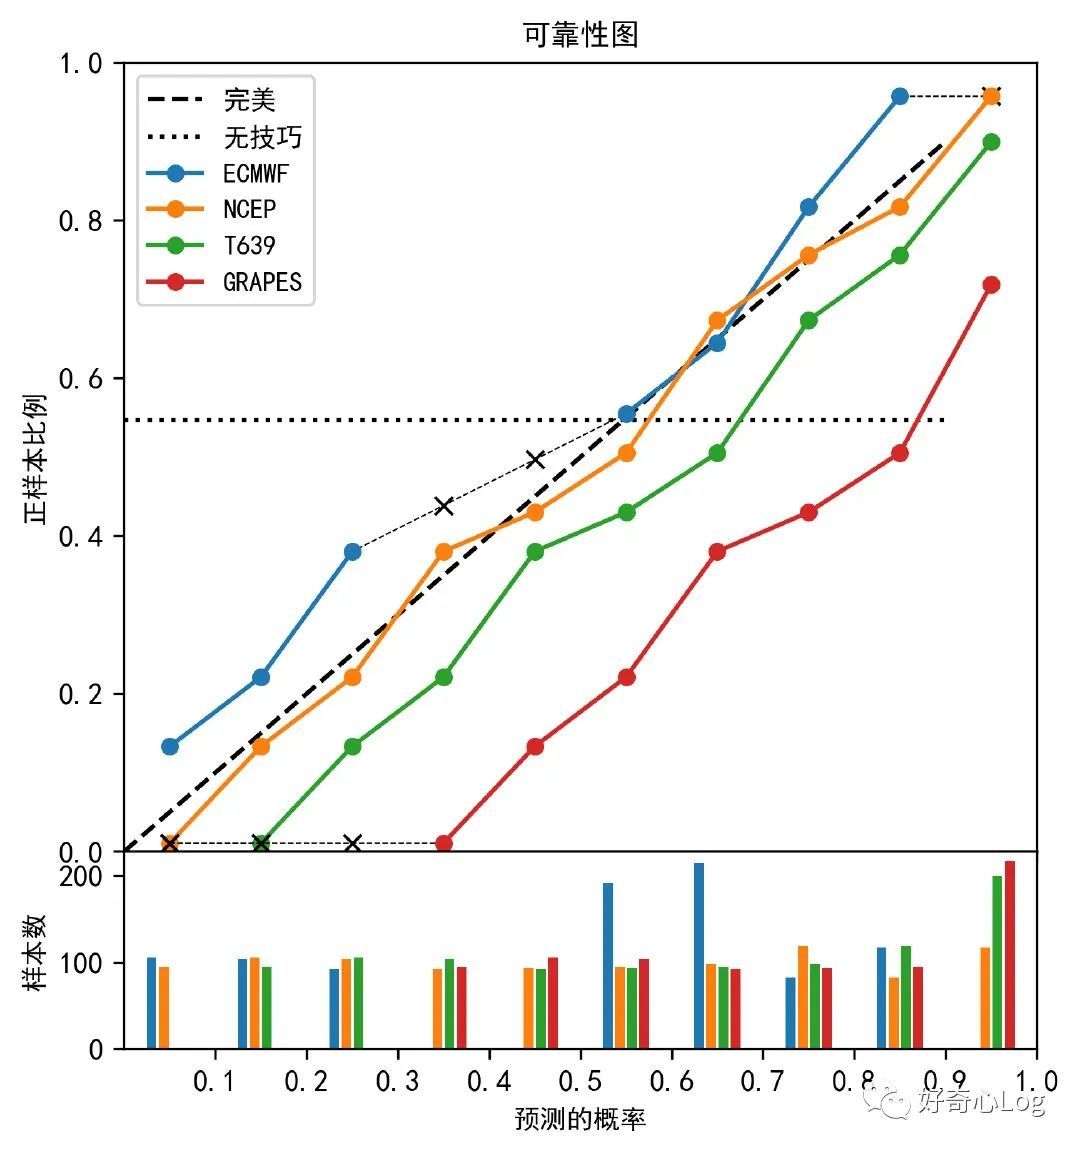
- Reliability diagram
reliability()
Draw a reliability map, where the abscissa is the forecast probability. The longitudinal direction is divided into two sub-maps, the primary and secondary sub-maps, and the ordinate of the main map is the ratio of occurrence of live sample events in the same forecast probability interval. The second picture shows the number of forecast samples corresponding to each forecast interval.
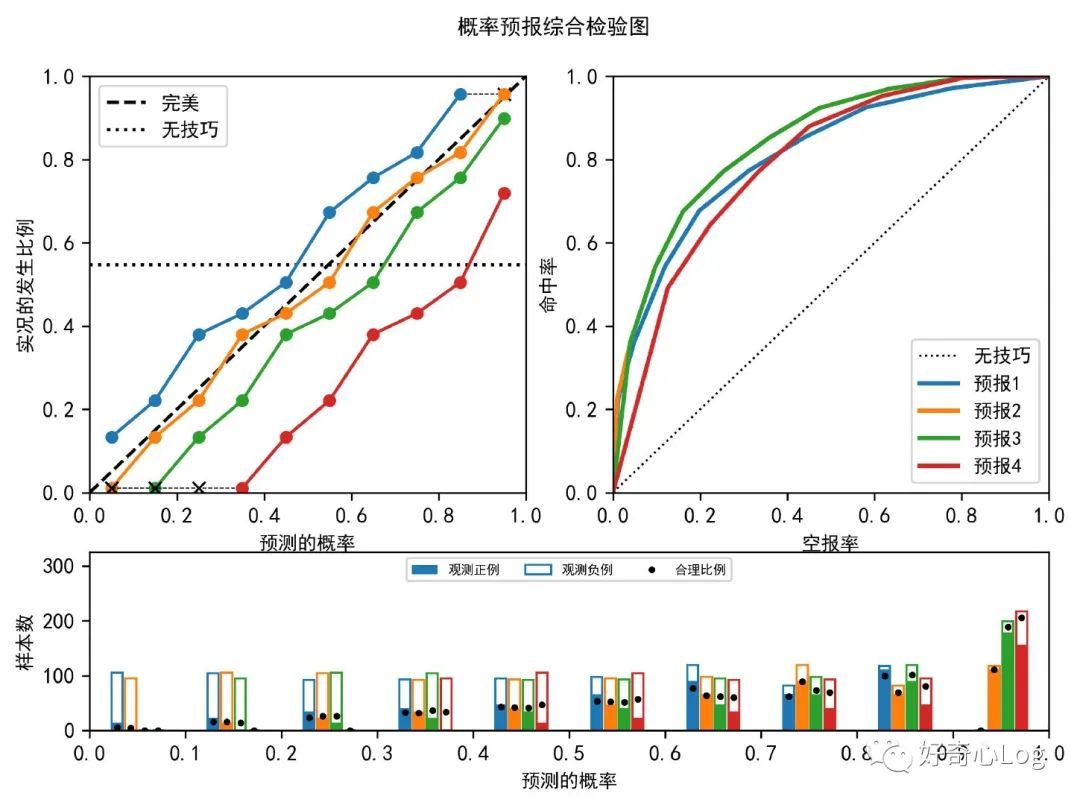
- Comprehensive inspection chart
comprehensive_probability()
Combination diagram of reliability diagram, ROC diagram and distinguishability diagram.
Ensemble forecast test
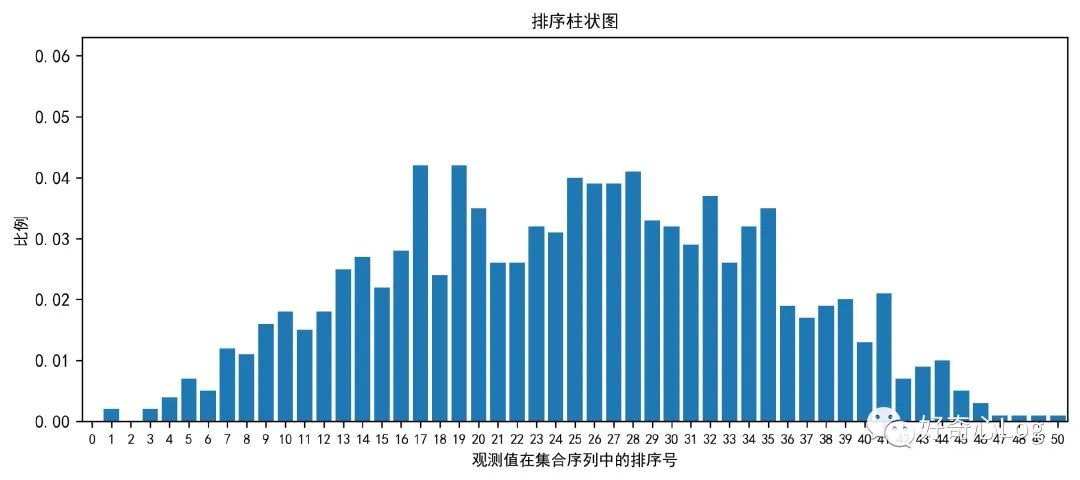
- Sort histogram
rank_histogram()
Reflects that the divergence time of the ensemble forecast is consistent with its uncertainty.
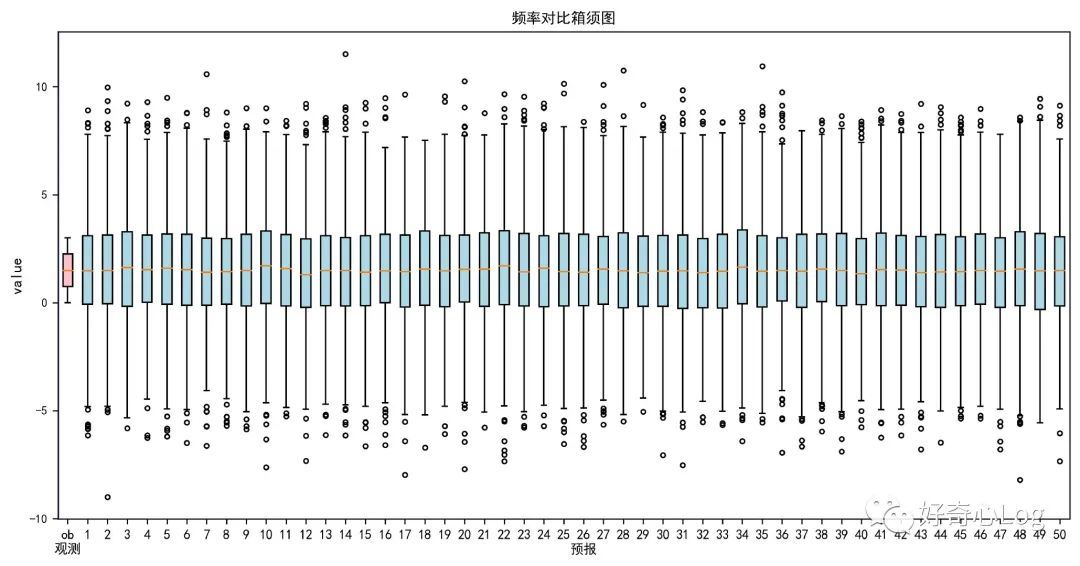
- Frequency comparison box and whisker plot
box_plot_ensemble()
The frequency box and whisker diagrams for observation and forecast are drawn respectively. The abscissa is "observation", "forecast", and the forecast member number, and the ordinate is the data value, including the first quartile, median, third and fourth Quantiles and outliers (outliers)
Spatial distribution comparison
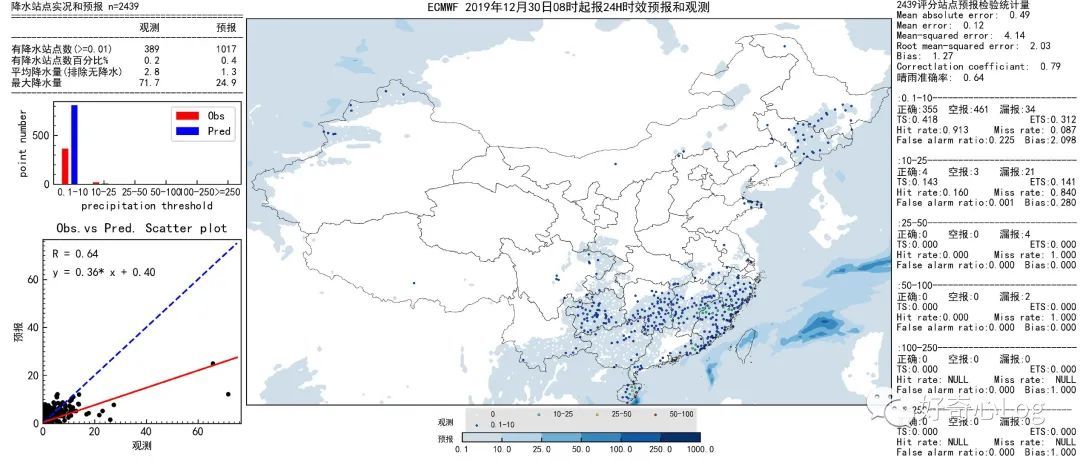
- Comprehensive comparison chart of precipitation forecast and observation distribution
rain_24h_comprehensive_sg()
Draw a comparison chart based on the input station observation data and grid forecast data
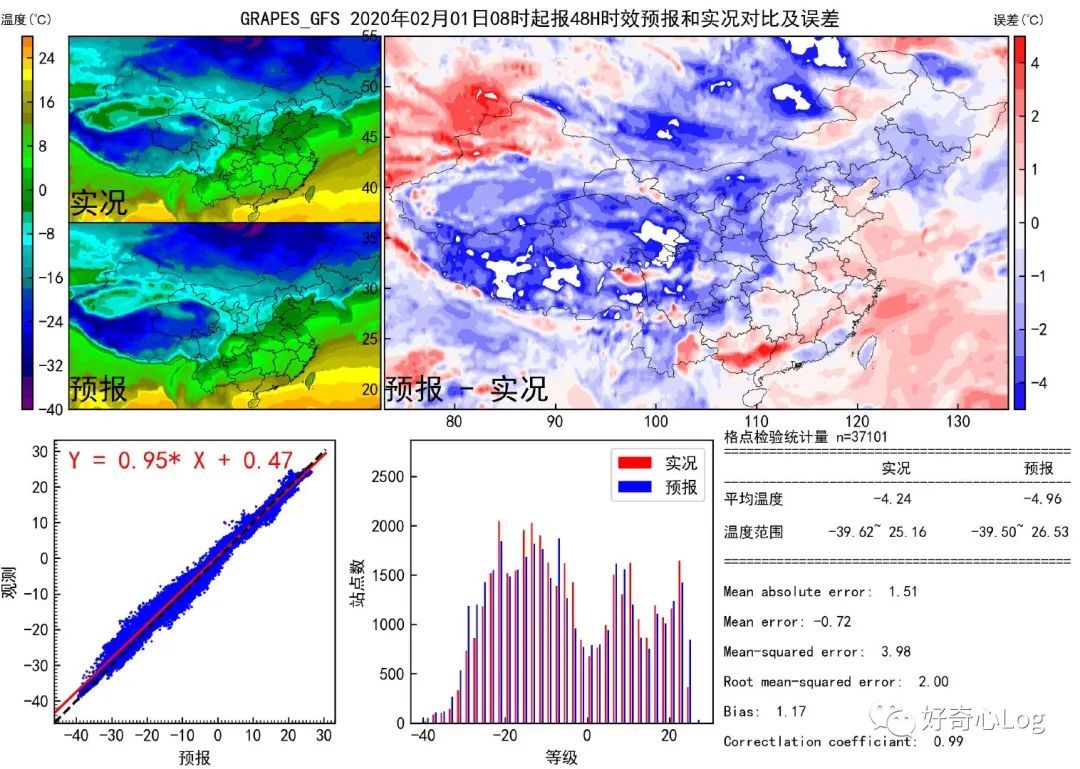
- Comprehensive comparison chart of temperature forecast and zero field distribution
temper_comprehensive_gg()
Error sequence analysis
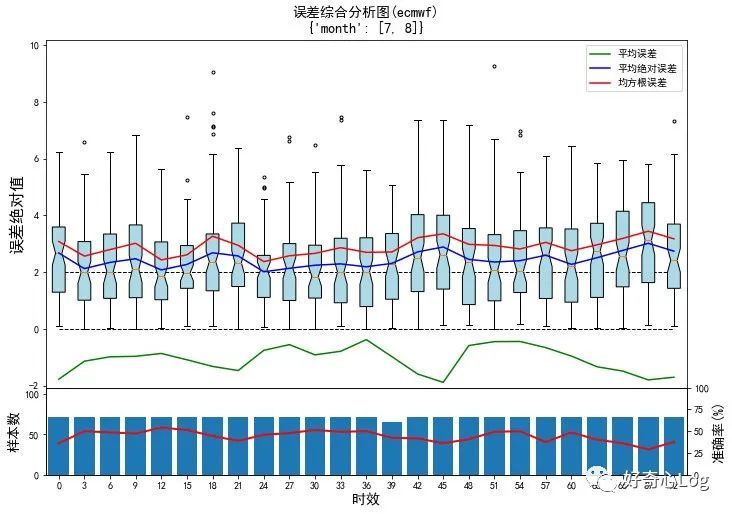
- Error comprehensive analysis graph (absolute value)
error_boxplot_abs()
According to the input site data, select part of the data, perform group inspection on the selected data, and draw a comprehensive error analysis diagram
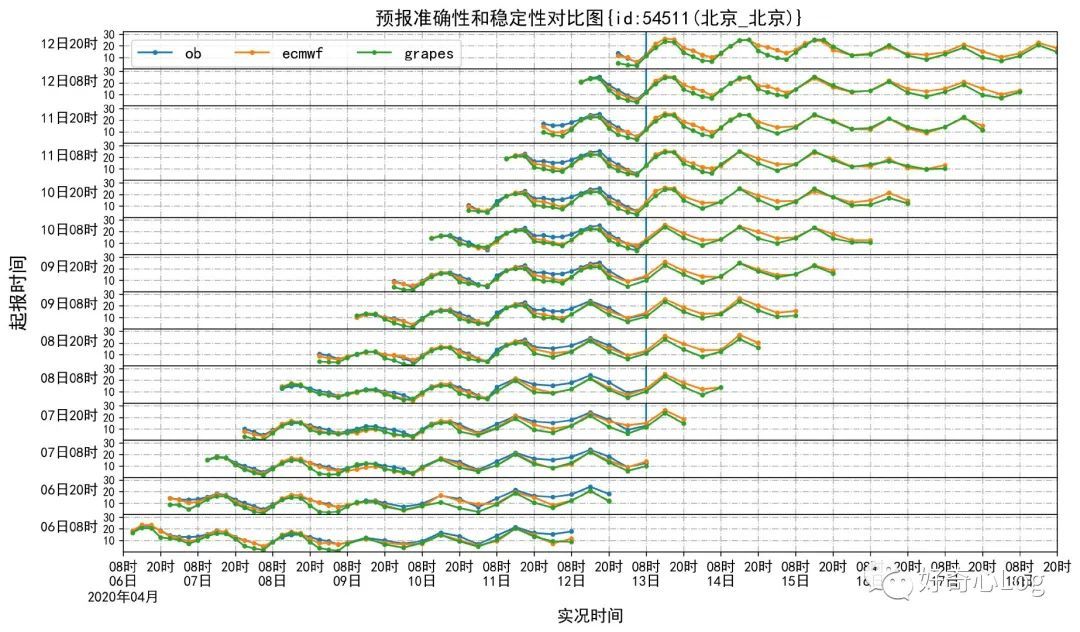
Time series comparison
- Multi-mode and multi-aging comparison chart
time_list_line()
The forecast and the actual situation reported at different times are displayed and compared in the same graph, which is convenient for timely detection of problems and superimposed and displayed in a curved manner.
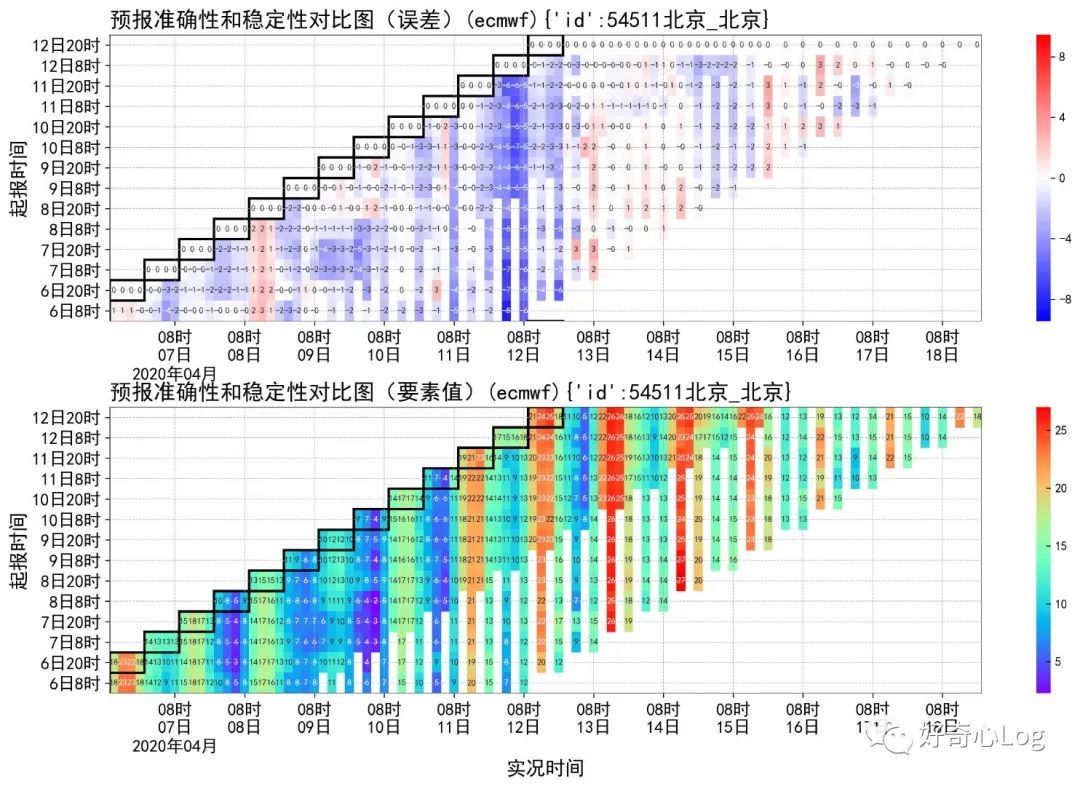
- Comparison chart of multi-time effect forecast error and stability
time_list_mesh()
It is convenient to display the element comparison chart and the error chart at the same time, and the error distribution of the error chart is more conspicuous and easier to find problems.
Official documents
The official document website of the whole process inspection procedure:
https://www.showdoc.cc/meteva
Github open source code URL:
https://github.com/nmcdev/meteva
Ending
Generally speaking, this whole-process inspection library includes very rich content, and also considers many details. It covers basically all mainstream inspection methods and inspection contents, and avoids re-creating wheels.
Friends who have a strong need for inspection work come and try.