BCI--Python-EEG Tool Library MNE
Python-EEG tool library MNE
One, environment configuration###
Install MNE-python
shell
pip install -U mne
test####
python
import mne
from mne.datasets import sample
import matplotlib.pyplot as plt
# The storage address of the sample, the following syntax is to get the data set from the network
# data_path = sample.data_path()
# The fif file storage address
fname ='F:/data/MNE-sample-data/MEG/sample/sample_audvis_raw.fif'"""
If the file exists in the address given above, load the local file directly,
If it does not exist, download the modified data online
"""
raw = mne.io.read_raw_fif(fname)"""
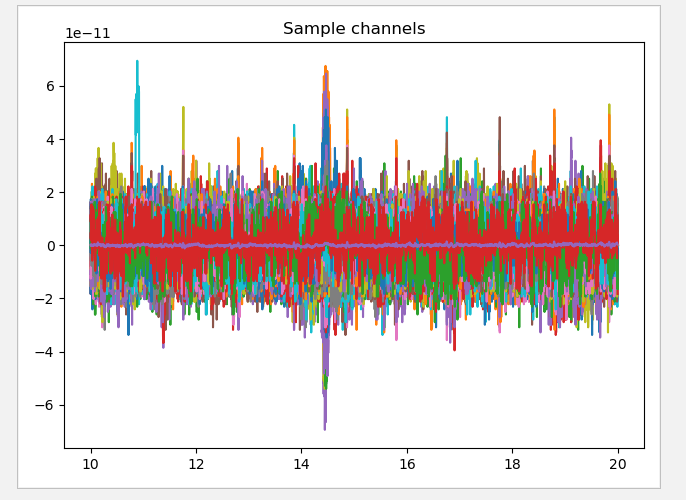
Case:
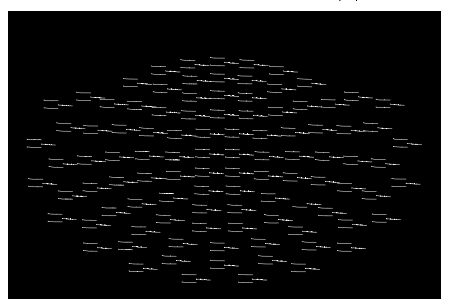
Get 10-Good MEG data within 20 seconds
# Choose those good MEG signals according to the type(Good MEG signal, exclude by setting="bads") channel,
The result is the index corresponding to the channels
"""
picks = mne.pick_types(raw.info, meg=True, exclude='bads')
t_idx = raw.time_as_index([10.,20.])
data, times = raw[picks, t_idx[0]:t_idx[1]]
plt.plot(times,data.T)
plt.title("Sample channels")
plt.show()
- The following picture appears, indicating that the environment has been successfully built
2. Introduction to Raw Data Structure and Its Usage in MNE###
**The Raw object is mainly used to store continuous data, the core data is n_channels and times, and also contains the Info object. **
1、 Open raw data####
python
# Introduce python library
import mne
from mne.datasets import sample
import matplotlib.pyplot as plt

# The storage address of the sample, the following is download from the network address
# data_path = sample.data_path()

# Open the local data, the fif file storage address
fname = data_path +'/MEG/sample/sample_audvis_raw.fif'"""
If the file exists in the address given above, load the local file directly,
If it does not exist, download the modified data online
"""
raw = mne.io.read_raw_fif(fname)
python
# Usually raw data access methods are as follows:
data, times = raw[picks, time_slice]

# picks:It is an index selected according to conditions;
# time_slice:Time slice

# To get all the data in raw, the following two methods are available:
data,times=raw[:]
data,times=raw[:,:]
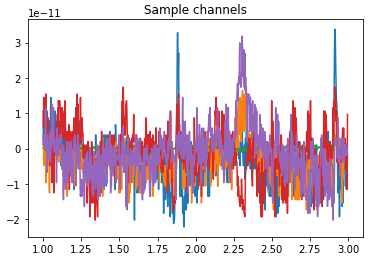
2、 sfreq: sampling frequency####
python
"""
sfreq: sampling frequency

raw returns the data and time points of the selected channel and time period,
Assign values to data and times respectively (that is, the raw object returns two arrays)
"""
sfreq=raw.info['sfreq']
data,times=raw[:5,int(sfreq*1):int(sfreq*3)]
plt.plot(times,data.T)
plt.title("Sample channels")
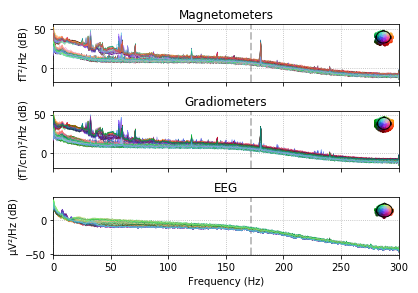
3、 Plot the power spectral density of each channel####
python
raw.plot_psd()
plt.show()
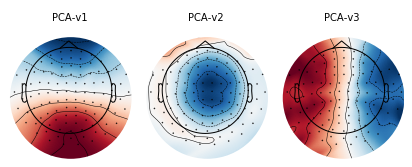
4、 Draw SSP vector
python
raw.plot_projs_topomap()
plt.show()
5、 Draw channel spectrogram as topography
python
raw.plot_psd_topo()
plt.show()
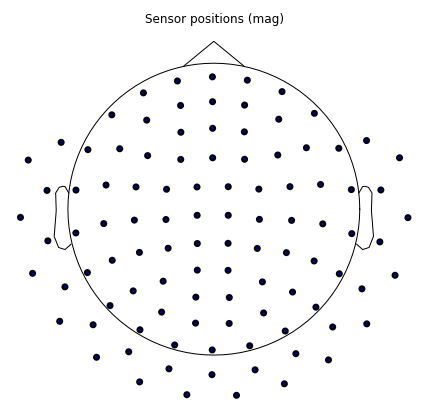
6、 Draw electrode position####
python
raw.plot_sensors()
plt.show()
Three, MNE creates Raw objects from scratch
1、 a brief introdction####
**In the actual process, sometimes it is necessary to construct data from scratch to create Raw objects. **Method: manually create Raw through the mne.io.RawArray class
Note: When using mne.io.RawArray to create a Raw object, its constructor only accepts matrix and info objects.
Data corresponding unit:
V: eeg, eog, seeg, emg, ecg, bio, ecogT: magT/m: gradM: hbo, hbrAm: dipoleAU: misc
When constructing a Raw object, you need to prepare two kinds of data, one is data data, the other is Info data,
data data is a two-dimensional data, the shape is (n_channels,n_times)
2、 Packing data####
python
"""
Generate a two-dimensional random data with a size of 5x1000
Where 5 represents 5 channels, 1000 represents times
"""
data = np.random.randn(5,1000)"""
Create info structure,
Contents include: channel name and channel type
Set the sampling frequency to:sfreq=100"""
info = mne.create_info(
 ch_names=['MEG1','MEG2','EEG1','EEG2','EOG'],
 ch_types=['grad','grad','eeg','eeg','eog'],
 sfreq=100)

custom_raw = mne.io.RawArray(data,info)
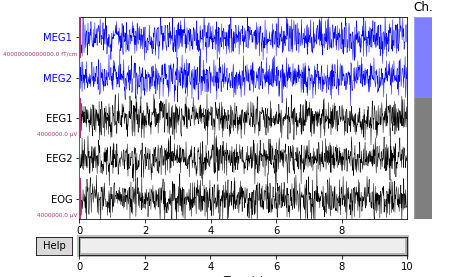
3、 Scale the graph####
python
"""
Scale the graph

For the actual EEG/For MEG data, different scale factors should be used.
Reduce the data of channels eeg, grad, and eog by 2 times
"""

scalings ={'eeg':2,'grad':2,'eog':2}

# scalings ='auto'Set auto zoom

custom_raw.plot(n_channels=5,
    scalings=scalings,
    title='Data from arrays',
    show=True,
    block=True)
plt.show()
Fourth, the data structure in MNE Epoch
Extract some specific time windows from the continuous EEG signals. These time windows can be called epochs.
1、 There are three ways to create Epochs objects:
- (1) Through Raw objects and event times (event times)-
- (2) Generate Epoch objects by reading .fif file data
- (3) Create Epoch objects from scratch through mne.EpochsArray
2、 Read fif file to create Epoch object####
python
step:
1 ) Read the fif file and construct the raw object;2) Create event object;
3 ) Create an epoch object;
4 ) Overlay the epoch to get the evoked object;
5 ) Draw evoked.
import mne
from mne import io
from mne.datasets import sample
# Download from the web
data_path = sample.data_path()
raw_fname = data_path +'/MEG/sample/sample_audvis_filt-0-40_raw.fif'
event_fname = data_path +'/MEG/sample/sample_audvis_filt-0-40_raw-eve.fif'
event_id, tmin, tmax =1,-0.2,0.5
# Read fif file,Create raw objects
raw = io.read_raw_fif(raw_fname)
# Read the fif file containing event and create event object
events = mne.read_events(event_fname)"""
Select channel:EEG + MEG - bad channels
"""
raw.info['bads']+=['MEG 2443','EEG 053'] # bads +2 more
picks = mne.pick_types(raw.info, meg=True, eeg=False, stim=True, eog=True,
exclude='bads')
# Read Epoch data
epochs = mne.Epochs(raw, events, event_id, tmin, tmax, proj=True,
picks=picks, baseline=(None,0), preload=True,
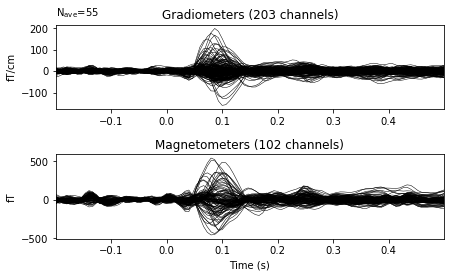
reject=dict(grad=4000e-13, mag=4e-12, eog=150e-6))"""
Average the epochs data to obtain the induced response
"""
evoked = epochs.average()
evoked.plot(time_unit='s')
plt.show()
3、 Create Epoch objects from scratch
Epochs object is a way to represent continuous data as a collection of time periods
Method: Use
mne.EpochsArrayto create an Epochs object. You can directly construct a numpy array when creating it. The shape of the array must be(n_epochs, n_chans, n_times)
**Data corresponding unit: **
- V: eeg, eog, seeg, emg, ecg, bio, ecog
- T: mag
- T/m: grad
- M: hbo, hbr
- Am: dipole
- AU: misc
The first step: build data
python
Step 1: Build the data

Construct a three-dimensional array with a size of 10x5x200, the data in the array are random numbers;
The first dimension data representation: 10 epochs
The second dimension data representation: 5 channels
Data in the third dimension: 2 seconds per epoch

# Sampling frequency
sfreq =100
data = np.random.randn(10,5, sfreq *2)

# Create an info structure
info = mne.create_info(
 ch_names=['MEG1','MEG2','EEG1','EEG2','EOG'],
 ch_types=['grad','grad','eeg','eeg','eog'],
 sfreq=sfreq
)
Step 2: Build events
python
When creating an Epochs object, you must provide a"events"Array,

event(event)Describes a certain kind of waveform(symptom)The starting point of, which is a triplet with the shape(n_events,3):
The starting sampling point of the event described by an integer in the first column of elements;
The elements in the second column correspond to the stimulus channel of the current event source(stimulus channel)Previous value of(previous value),This value is 0 in most cases;
The third column of elements represents the id of the event.

events = np.array([[0,0,1],[1,0,2],[2,0,1],[3,0,2],[4,0,1],[5,0,2],[6,0,1],[7,0,2],[8,0,1],[9,0,2],])
python
Set the id of the event
If it is a dict, you can use these keys to access the associated events later. Example: dict (auditory=1. Vision=3)
If it is an int, a dict with an id of string will be created.
If it is a list, all events with the specified ID in the list are used.
If not, all events will be used together, and a dict will be created with the string integer name corresponding to the event id integer.
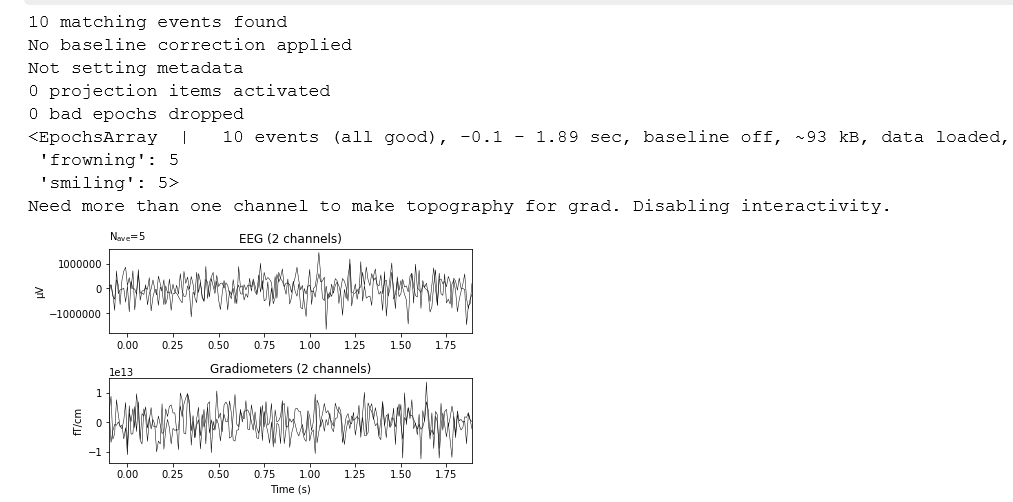
# Create event id, subject either smiles or frowns
event_id =dict(smiling=1, frowning=2)"""
tmin:The time before the event starts, if not specified, the default is 0"""
# Set the time before the event to-0.1s
tmin =-0.1
Step 3: Create epochs object
python
"""
Use mne.EpochsArray creates epochs object
"""
custom_epochs = mne.EpochsArray(data, info, events, tmin, event_id)print(custom_epochs)
# draw
_ = custom_epochs['smiling'].average().plot(time_unit='s')
4、 View epoch objects
**The epochs object is similar to the mne.io.Raw object and also has the info attribute and event attribute. **
You can view event related information in the epoch in the following two ways
python
print(epochs.events[:3])print(epochs.event_id)print(epochs[1:5])print(epochs['Auditory/Right'])

# search for
print(epochs['Right'])print(epochs['Right','Left'])
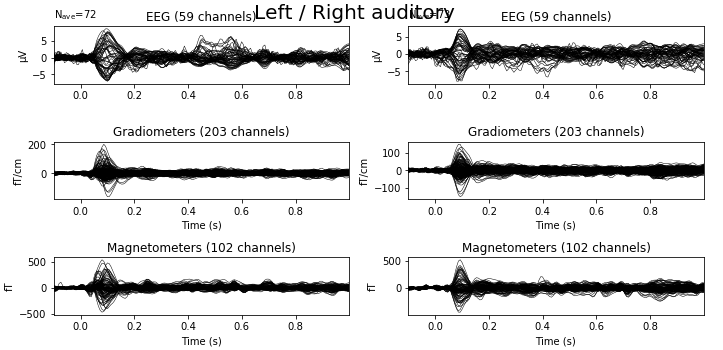
5、 epoch average overlay
**The Evoked object can be returned by calling the mne.Epochs.average() method, and the average() method can specify the required channel through parameters. **
python
ev_right = epochs['Right'].average()
ev_left = epochs['Left'].average()

f, axs = plt.subplots(3,2, figsize=(10,5))
_ = f.suptitle('Left / Right auditory', fontsize=20)
_ = ev_left.plot(axes=axs[:,0], show=False, time_unit='s')
_ = ev_right.plot(axes=axs[:,1], show=False, time_unit='s')
plt.tight_layout()
6、 Metadata in Epoch Objects (metadata)
Sometimes it is particularly useful to use the metadata property of mne to store related data. Metadata uses pandas.DataFrame to encapsulate the data. Each row corresponds to an epoch, and each column corresponds to the metadata attribute of an epoch. The column must contain a string, integer, or floating point number.
7、 EpochsData Visualization
mne.Epochs.plot() provides an interactive browser that allows manual rejection when combined with the keyword block = True. This will prevent the script from executing until the browser window is closed.
python
"""
Load data, if there is no such data locally,
Download from the network
"""
data_path = op.join(mne.datasets.sample.data_path(),'MEG','sample')

raw = mne.io.read_raw_fif(
 op.join(data_path,'sample_audvis_filt-0-40_raw.fif'), preload=True)
# Set event ID
event_id ={'auditory/left':1,'auditory/right':2,'visual/left':3,'visual/right':4,'smiley':5,'button':32}
events = mne.find_events(raw)
epochs = mne.Epochs(raw, events, event_id=event_id, tmin=-0.2, tmax=.5,
     preload=True)
python
# Draw epochs
epochs.plot(block=True)
plt.show()
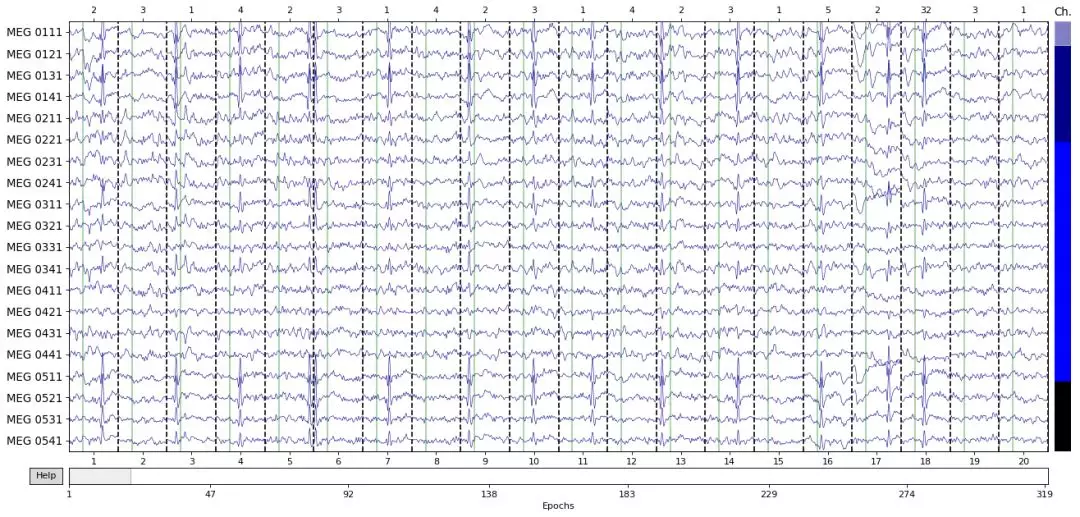
**The number at the top represents the event id of the epoch. The number at the bottom is the running number of each epoch. **
Five, Evoked structure
Evoked potential (EP) evoked potential or evoked response refers to a specific pattern of potential recorded from the nervous system of humans or other animals, especially a specific part of the brain after a stimulus such as flashing or pure tone. Different forms and types of stimulation will produce different types of potentials.
The evoked potential amplitude is often low, ranging from less than 1 microvolt to several microvolts, while the EEG is tens of microvolts, the EMG is millivolts, and the ECG is usually close to 20 millivolts. In order to solve these low-amplitude potentials in the context of biological signals such as EEG, ECG, EMG, and environmental noise, it is usually necessary to average the signals. ** The signal is time-locked to the stimulus, and most of the noise is generated randomly, so that the noise can be averaged out by responding to repeated responses. **
The evoked potential (Evoked) structure is mainly used to store the average data during the experiment. In MNE, creating an Evoked object usually uses mne.Epochs.average() to average epochs data.
Recommended Posts