Online environment Linux system call tracking
Speaking of how to dynamically track system calls in the process, I believe everyone can think of strace at the first time. Its basic usage is very simple and it is very suitable for solving "Why can't this software run on this machine?" problems. However, if you need to analyze the delay of certain system calls of online services (especially delay-sensitive), strace is not so suitable because the overhead it introduces will be very large. According to the test results of performance analysis master Brendan Gregg, The running speed of the target process tracked by strace will be reduced by more than 100 times, which will be a disaster for the production environment.
So is there a better tool to use in the production environment? The answer is yes, the following will introduce the commonly used commands of the two tools for easy reference when you need them.
Perf
As we all know, perf is a very powerful performance tool under the Linux system, which is constantly evolving and optimized by Linux kernel developers. In addition to analyzing PMU (Performance Monitoring Unit) hardware events, kernel events and other general functions, perf also provides other "submodules", such as sched analysis scheduler, timechart visualizes system behavior based on load characteristics, and c2c analyzes possible false sharing (RedHat has tested this set of c2c development prototypes on a large number of Linux applications, and successfully discovered many hot issues with pseudo-shared cache lines.) etc., while trace can be used to analyze system calls, which is very powerful and guarantees To achieve an acceptable overhead-the running speed is only 1.36 times slower (dd as the test load) Let's take a look at a few common scenarios:
- The top ranking of the number of syscall calls
perf top -F 49-e raw_syscalls:sys_enter --sort comm,dso --show-nr-samples
It can be seen from the output that during the sampling period, kube-The apiserver calls syscall the most times.
- Display system call information that exceeds a certain delay
perf trace --duration 200
From the output, you can see the process name, pid, specific system call parameters and return values that exceed 200 ms.
- Count the cost of system calls in a certain process over a period of time
perf trace -p $PID -s
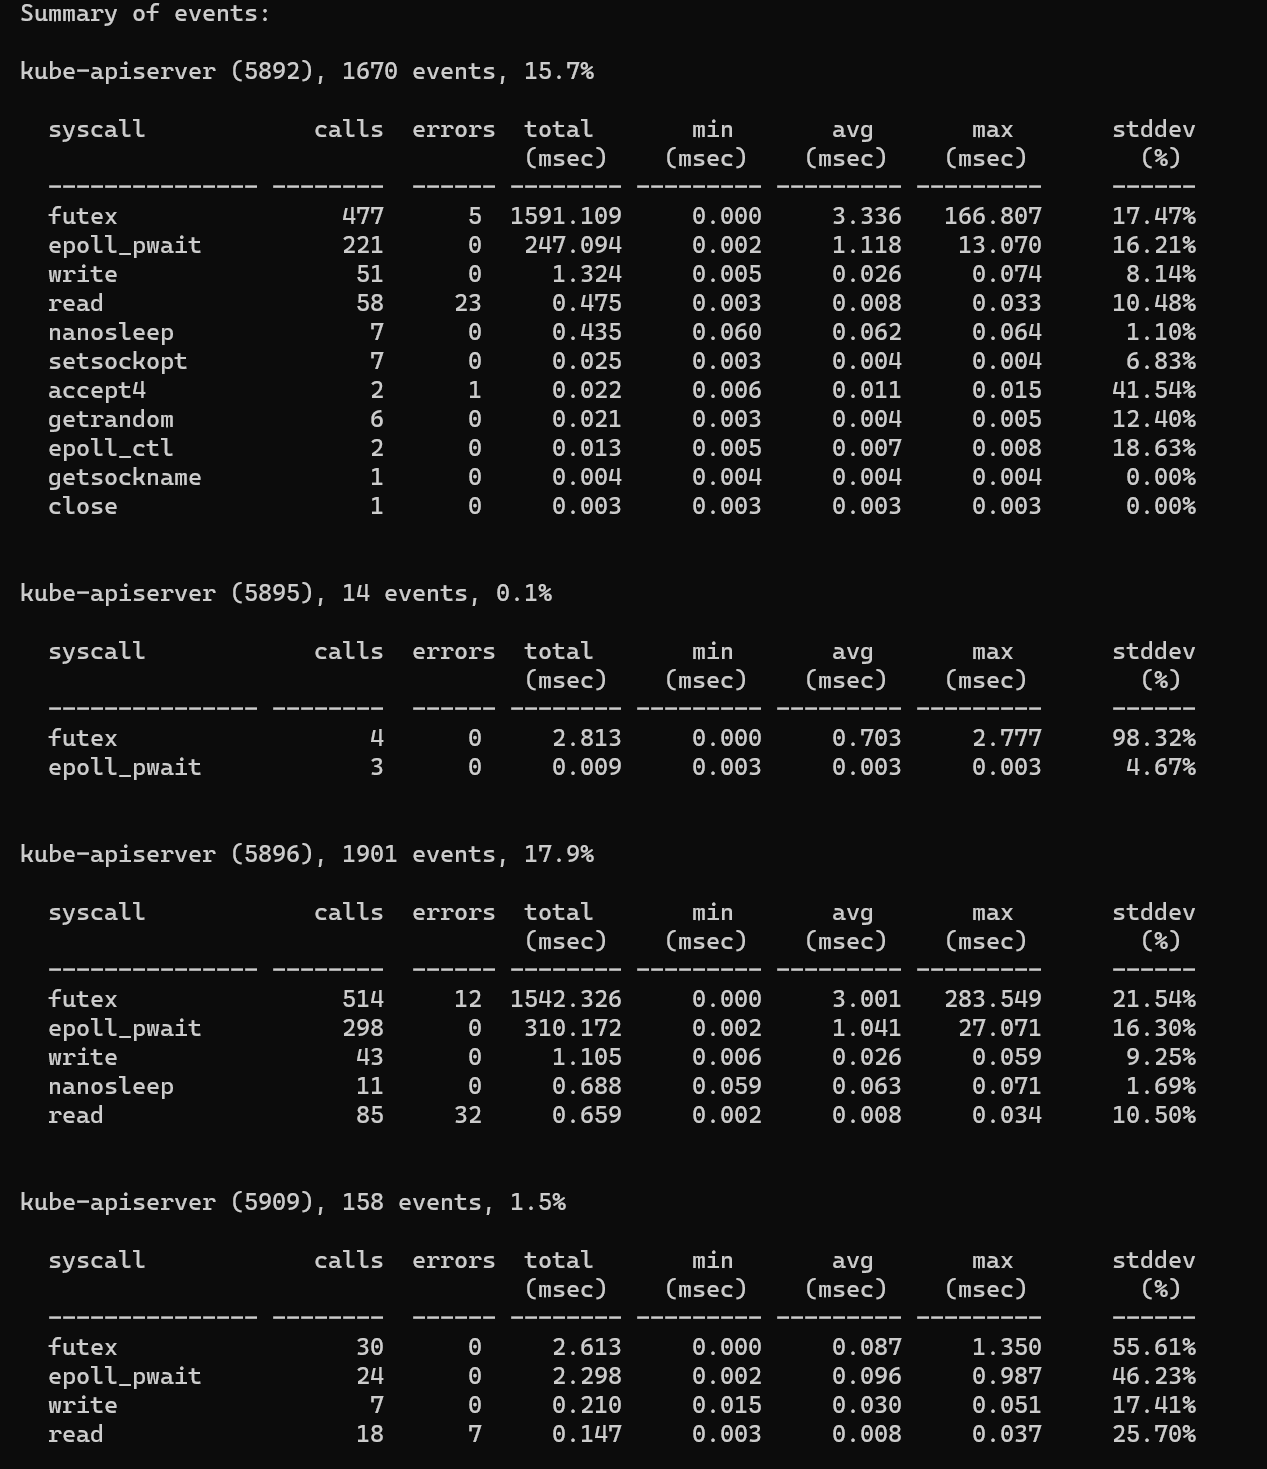
From the output, you can see the number of system calls, the number of errors returned, the total delay, and the average delay.
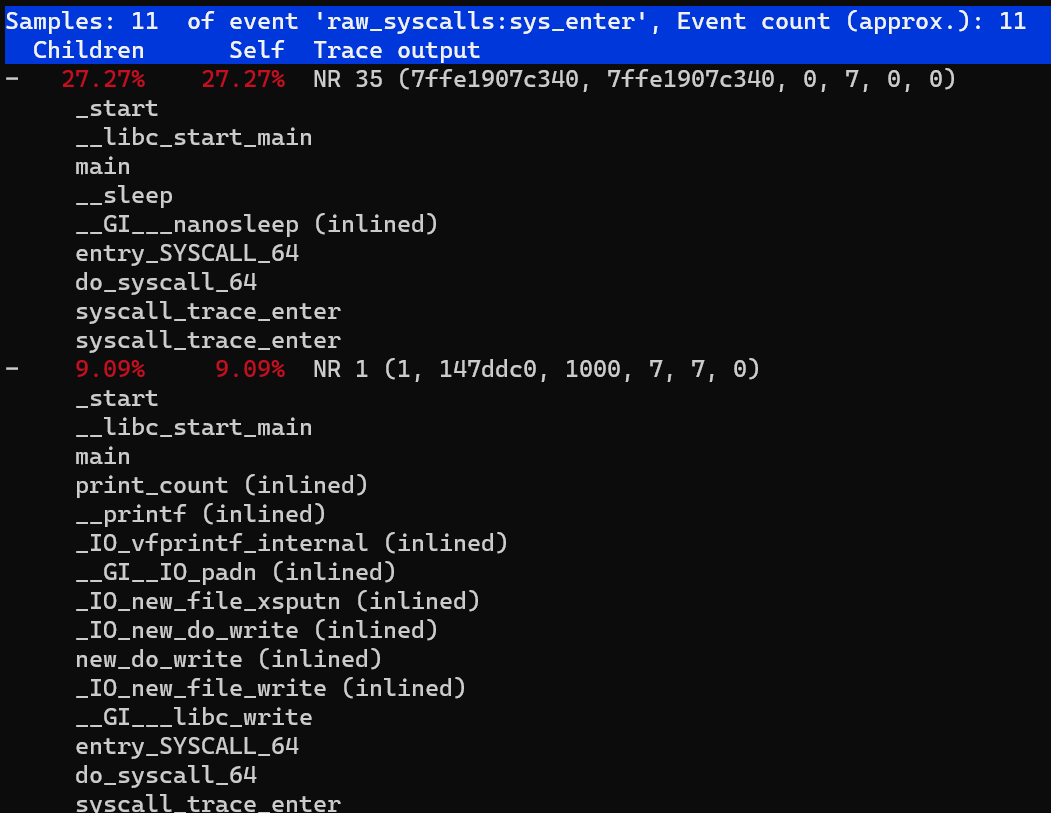
- We can also further analyze the high-latency call stack information
perf trace record --call-graph dwarf -p $PID -- sleep 10
- Trace a group of tasks. For example, there are two bpf tools running in the background. If we want to see their system call usage, we can add them to the perf_event cgroup first, and then execute perf trace:
mkdir /sys/fs/cgroup/perf_event/bpftools/
echo 22542>>/sys/fs/cgroup/perf_event/bpftools/tasks
echo 20514>>/sys/fs/cgroup/perf_event/bpftools/tasks
perf trace -G bpftools -a -- sleep 10

The use of perf-trace is introduced here. For more usage, please refer to the man manual. From the above, you can see that the function of perf-trace is very powerful. It can be filtered according to pid or tid. But it seems that there is no convenient support for containers and K8S environments. Don't worry, the tool introduced next is for containers and K8S environments.
Traceloop
You may be a little unfamiliar with Traceloop, but when it comes to BCC, you must be familiar with it. The front end of BCC is Python/C++, and there is a project under its iovisor called gobpf which is the go binding of BCC. Traceloop is developed based on the gobpf library. The main target application scenarios of this project are containers and K8S environments. The principle is relatively simple, and its architecture is shown in the figure:
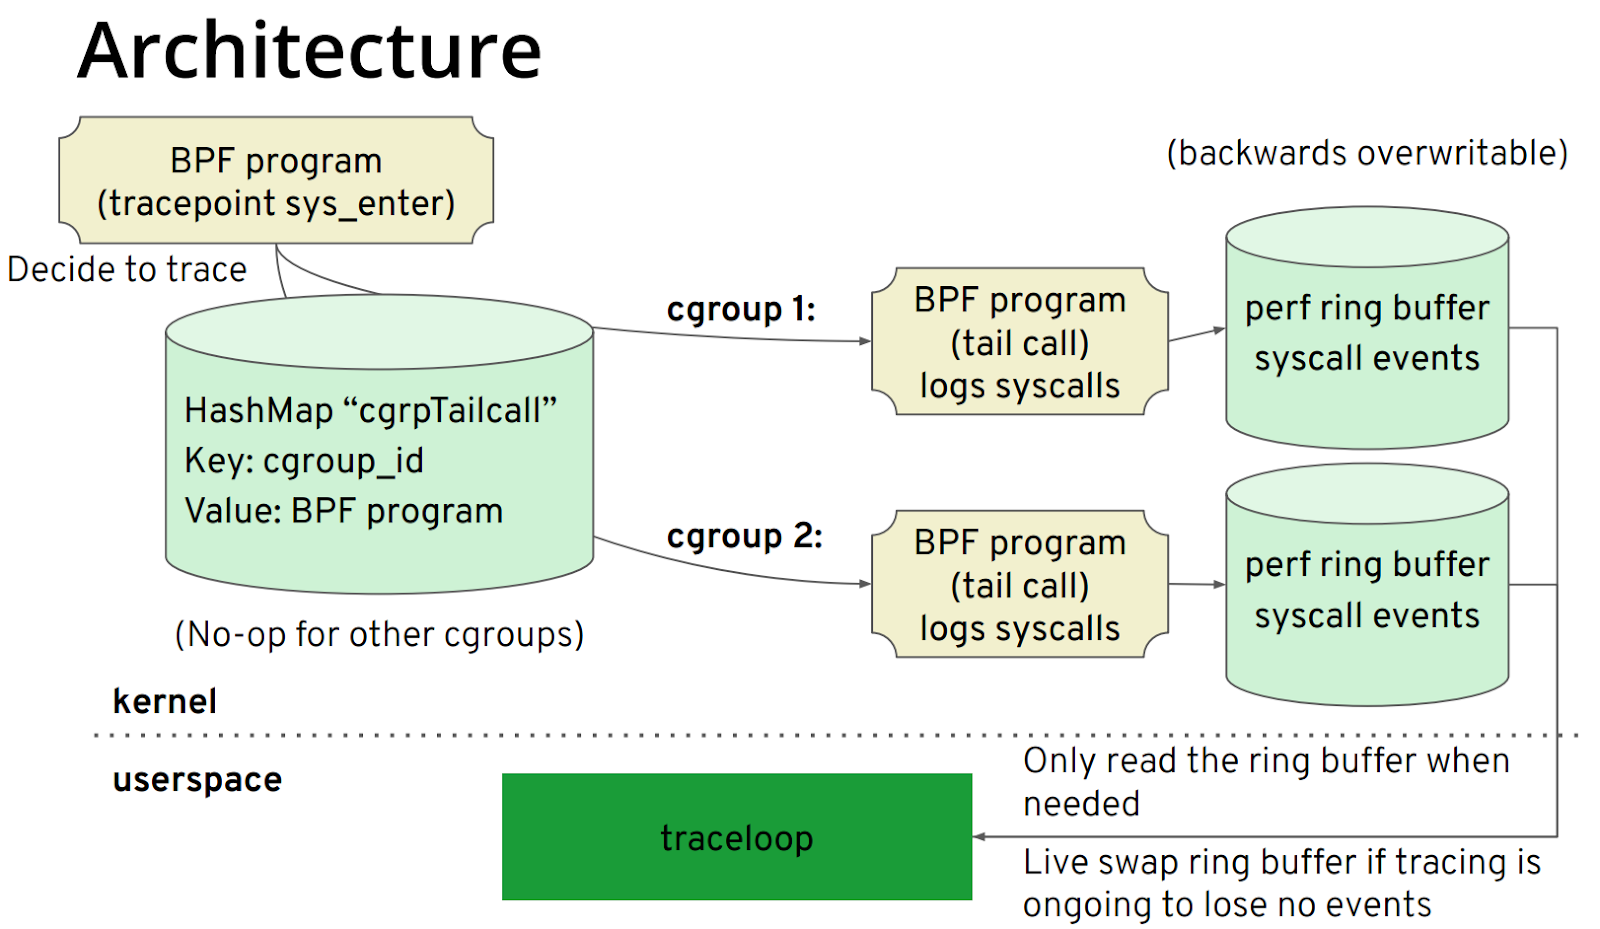
The core steps are as follows:
- Use bpf helper to get the cgroup id, and filter according to the cgroup id instead of pid and tid.
- Each cgroup id corresponds to a bpf tail call. In this way, the perf ring buffer corresponding to this cgroup id can be written.
- User space reads the corresponding perf ring buffer according to the cgroup id.
It should be noted that the current method of obtaining the cgroup id is obtained through bpf helper: bpf_get_current_cgroup_id. This id is only available in cgroup v2. Therefore, it is only applicable to the environment where cgroup v2 is enabled. It is not sure whether this project team intends to support cgroup v1 by reading nsproxy data structure, etc., so only a brief introduction is given here. As K8S version 1.19 starts to support cgroup v2, I hope that cgroup v2 will become popular as soon as possible. The following uses Centos 8 version 4.18 kernel for a simple demonstration: dump system call information when traceloop exits
sudo -E ./traceloop cgroups --dump-on-exit /sys/fs/cgroup/system.slice/sshd.service
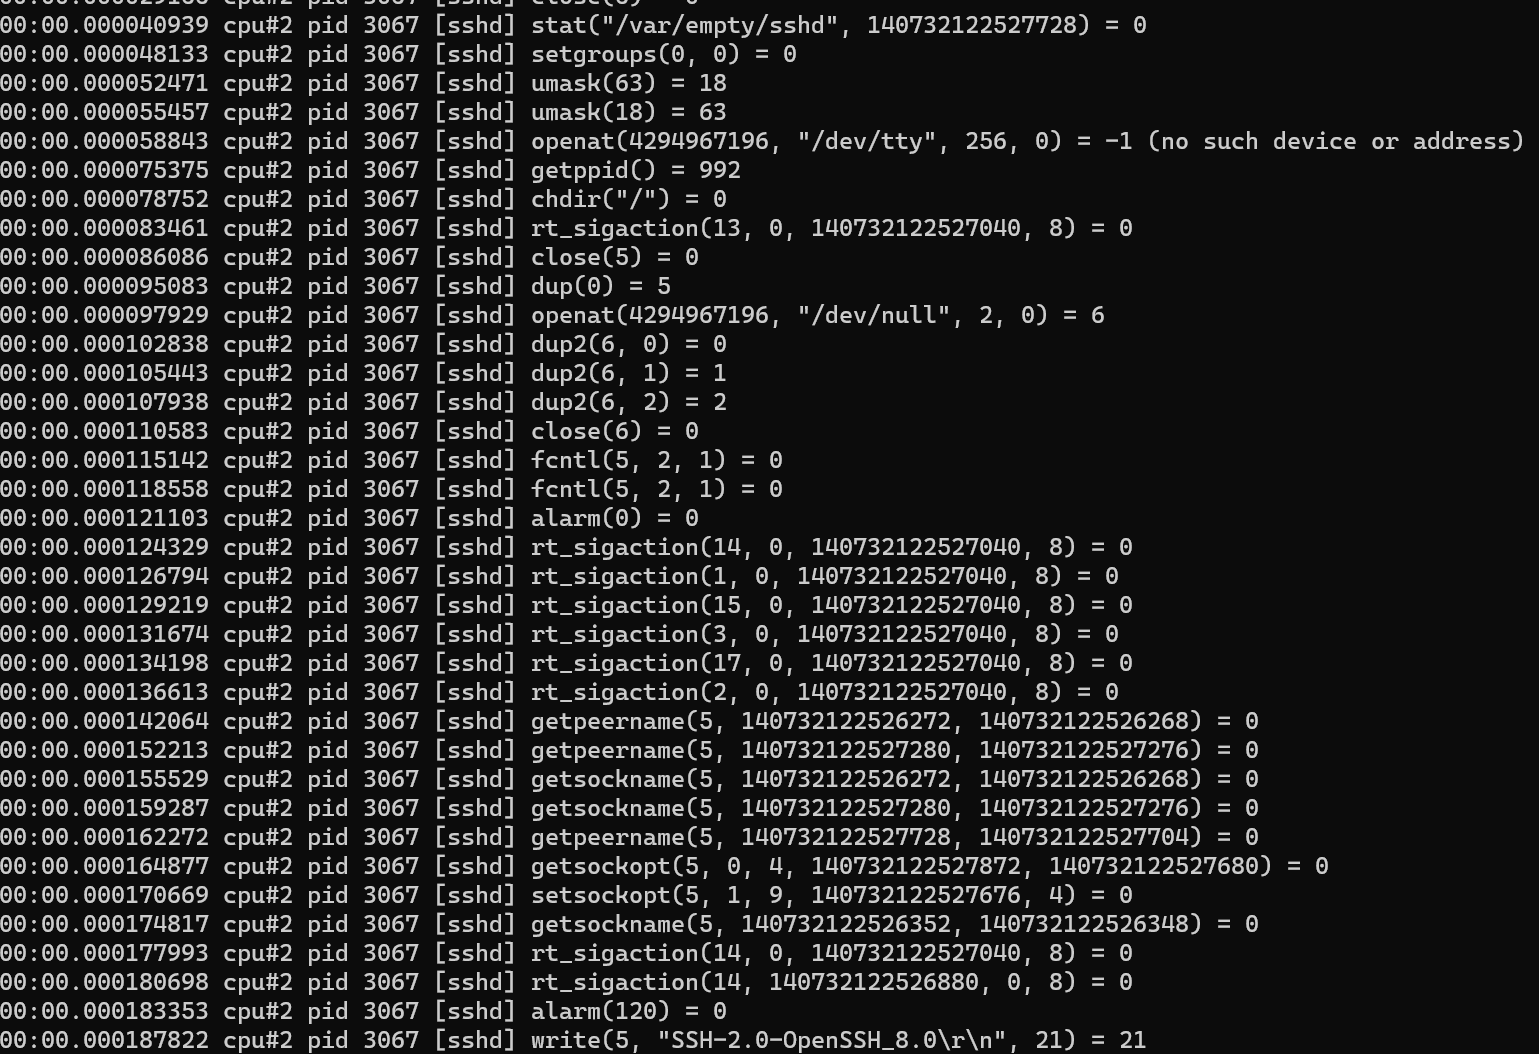
As you can see from the output, its output is similar to strace/perf trace, except that it filters for cgroups. It should be noted that Centos 8 does not mount cgroup v2 to /sys/fs/cgroup/unified like Ubuntu, but directly mounts to /sys/fs/cgroup. It is recommended to execute mount -t cgroup2 before use. Determine the mount information.
For the K8S platform, the team integrated traceloop into the Inspektor Gadget project, and run it through the kubectl plug-in. Since the pipe network gives detailed gif examples, I won’t introduce too much here. Friends who need cgroup v2 can try Give it a try.
Benchmark
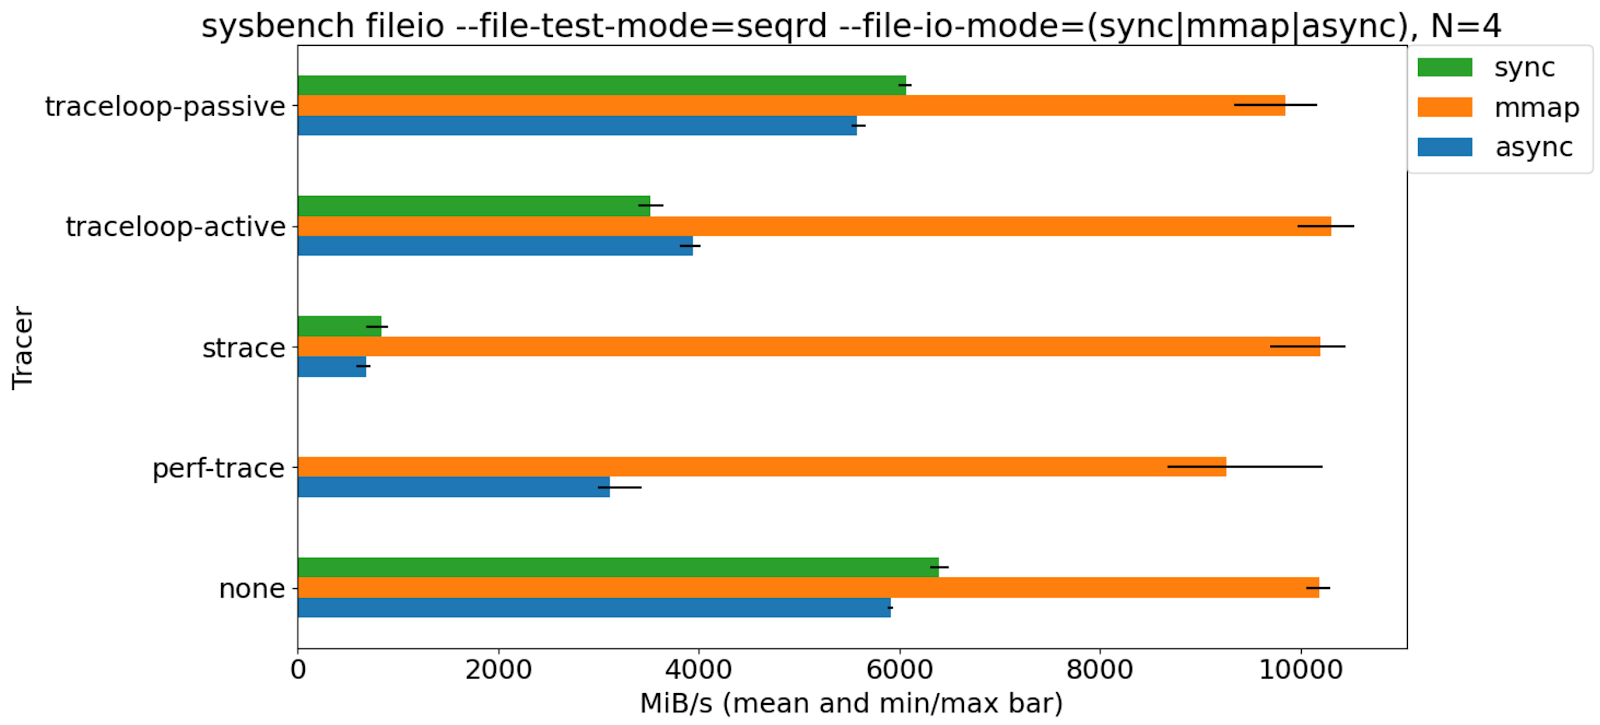
From the benchmark results, the performance degradation of the target program caused by strace is the largest, followed by perf trace, and traceloop is the smallest.
to sum up##
strace is still a powerful tool for solving related problems of "Why can't this software run on this machine?", but for analyzing system call delays and other issues, perf trace is a suitable choice. It is also based on the implementation of BPF. For those using cgroup v2 Container, K8S environment, traceloop will be more convenient.