Python draws a visual line chart
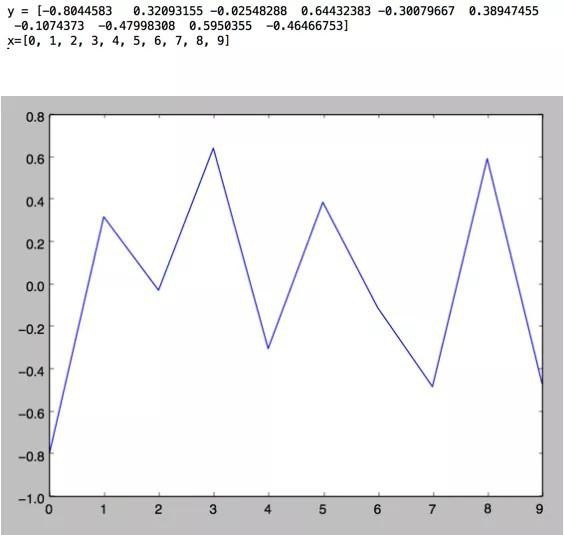
1. Use Numpy ndarray as data into ply
import numpy as np
import matplotlib as mpl
import matplotlib.pyplot as plt

np.random.seed(1000)
y = np.random.standard_normal(10)
print "y = %s"% y
x =range(len(y))
print "x=%s"% x
plt.plot(y)
plt.show()
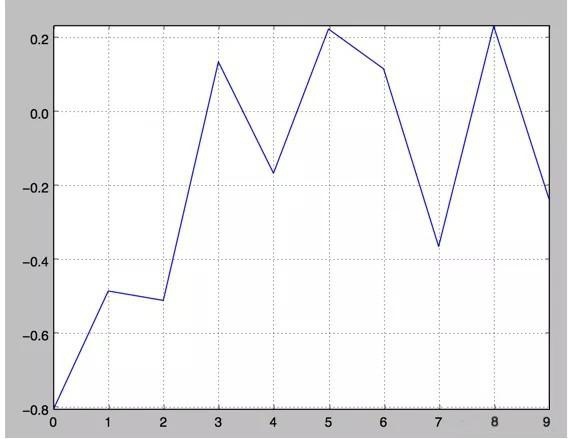
2. Functions for manipulating axes and adding grids and labels
import numpy as np
import matplotlib as mpl
import matplotlib.pyplot as plt

np.random.seed(1000)
y = np.random.standard_normal(10)
plt.plot(y.cumsum())
plt.grid(True) ##Increase grid
plt.axis('tight') #Coordinate axis adaptation data amount axis set coordinate axis
plt.show()
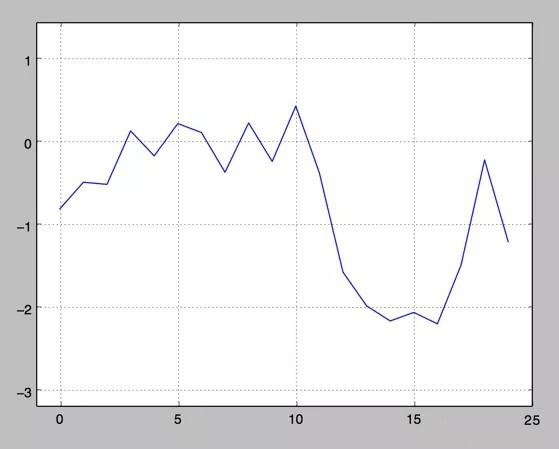
3. plt.xlim and plt.ylim set the minimum and maximum values of each axis
#! /etc/bin/python
# coding=utf-8import numpy as np
import matplotlib as mpl
import matplotlib.pyplot as plt

np.random.seed(1000)
y = np.random.standard_normal(20)
plt.plot(y.cumsum())
plt.grid(True) ##Increase grid
plt.xlim(-1,20)
plt.ylim(np.min(y.cumsum())-1, np.max(y.cumsum())+1)

plt.show()
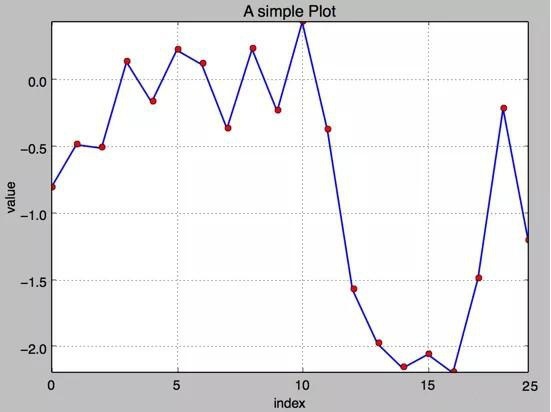
4. Add title and label plt.title, plt.xlabe, plt.ylabel discrete points, lines
#! /etc/bin/python
# coding=utf-8import numpy as np
import matplotlib as mpl
import matplotlib.pyplot as plt

np.random.seed(1000)
y = np.random.standard_normal(20)

plt.figure(figsize=(7,4)) #Canvas size
plt.plot(y.cumsum(),'b',lw =1.5) #Blue line
plt.plot(y.cumsum(),'ro') #Discrete points
plt.grid(True)
plt.axis('tight')
plt.xlabel('index')
plt.ylabel('value')
plt.title('A simple Plot')
plt.show()
The above is the detailed content of Python drawing visual line chart. For more information about Python drawing line chart, please pay attention to other related articles on ZaLou.Cn!