CentOS7はELKログ集中分析プラットフォームを構築します
これまで、運用・保守担当者がログを分析する場合、サーバーに1つずつログインし、sedおよびawkツールを使用して分析するか、シェルスクリプトまたはPythonスクリプトを使用してログを分析するのが最も一般的な方法だと思います。しかし、この方法は直感的でないだけでなく、非常に非効率的です。通常、ログはさまざまなデバイスに保存されます。数十または数百のサーバーを管理している場合は、プレイする必要があります。Ansibleのような自動化されたツールはありますが、あまり効率的ではありません。すべてのサーバーのログを収集して要約するには、オープンソースのsyslogなどの一元化されたログ管理を使用することが不可欠です。例:オープンソースsyslogは、すべてのサーバーのログを収集して要約します。
ログを一元管理した後、ログの統計と取得はより厄介なものになりました。一般に、grep、awk、wcなどのLinuxコマンドを使用して取得と統計を実現できますが、クエリ、並べ替え、統計などのより厳しい要件についてはそして、多くのマシンはまだこの方法を使用していますが、必然的に少し無力です。
ELKの紹介###
オープンソースのリアルタイムログ分析ELKプラットフォームは、上記の問題を完全に解決できます。ELKは、ElasticSearch、Logstash、Kiabanaの3つのオープンソースツールで構成されています。公式サイト: https:// www.elastic.co / products
- Elasticsearchは、オープンソースの分散検索エンジンです。その特徴は、分散、ゼロ構成、自動検出、自動インデックスシャーディング、インデックスコピーメカニズム、安らかなスタイルのインターフェイス、複数のデータソース、自動検索ロードなどです。
- Logstashは、ログを収集してフィルタリングし、後で使用するために保存できる完全にオープンソースのツールです(検索など)。
- Kibanaは、オープンソースの無料ツールでもあります。Kibanaは、LogstashとElasticSearchに、重要なデータログの要約、分析、検索に役立つログ分析に適したWebインターフェイスを提供できます。
**次の図は、elk **の動作原理を示しています。
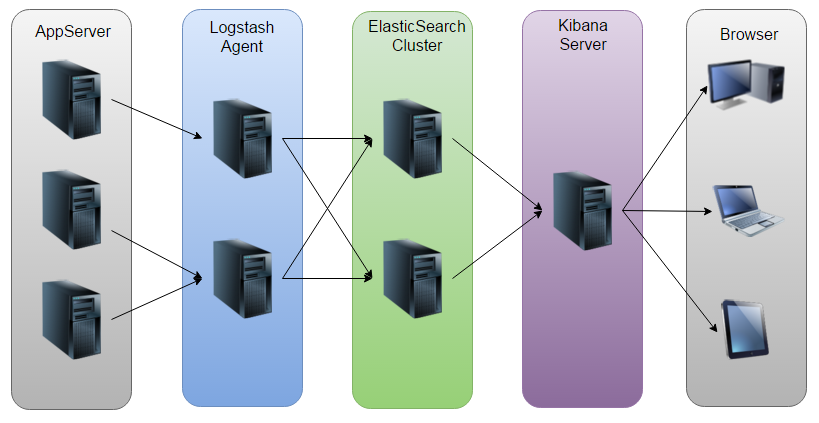
図に示すように、LogstashはAppServerによって生成されたログを収集してElasticSearchクラスターに格納し、KibanaはES(またはスタンドアロン)クラスターからデータを照会してグラフを生成し、それをブラウザーに返します。
ELKプラットフォームの構築###
一般的に、ELKプラットフォームはクラスターと単一のマシンに分割されます。手元のマシンのリソースは十分であるため、この記事ではスタンドアロン構造を例として取り上げます。
1. システム環境####
- System: CentOS Linux release 7.1.1503 (Core)
- ElasticSearch: 5.5.2
- Logstash: 5.5.2
- Kibana: 5.5.2
- Java: openjdk version “1.8.0_141”
- 注:Logstashの動作はJava環境に依存し、Logstash1.5以降はJava1.7以上であるため、最新バージョンのJavaを使用することをお勧めします。必要なのはJavaオペレーティング環境だけなので、JREしかインストールできませんが、ここではまだJDKを使用していますので、自分で検索してインストールしてください。 *
2. ELKソフトウェアのダウンロード####
[ root@tokyo software]# ls
elasticsearch-5.5.2.rpm  kibana-5.5.2-x86_64.rpm  logstash-5.5.2.rpm
3. Elasticsearchのインストール構成####
[ root@tokyo software]# rpm -ivh elasticsearch-5.5.2.rpm
[ root@tokyo software]# vim /etc/elasticsearch/elasticsearch.yml  #Elasticsearchのメイン構成ファイル
# - - - - - - - - - - - - - - - - - - - - - - - - - - - - - - - - - - クラスター(クラスター構成)-----------------------------------
#
# Use a descriptive name for your cluster:
#
# cluster.name: my-application  #クラスター名
# - - - - - - - - - - - - - - - - - - - - - - - - - - - - - - - - - - - - ノード(ノード構成)------------------------------------
#
# Use a descriptive name for the node:
#
# node.name: node-1  #ノード名
#
# Add custom attributes to the node:
#
# node.attr.rack: r1
# - - - - - - - - - - - - - - - - - - - - - - - - - - - - - - - - - - - パス(ディレクトリパス構成)------------------------------------
#
# Path to directory where to store the data(separate multiple locations by comma):
#
# path.data:/path/to/data #データストレージディレクトリ
#
# Path to log files:
#
# path.logs:/path/to/logs #ログストレージディレクトリ
#
# - - - - - - - - - - - - - - - - - - - - - - - - - - - - - - - - - - - メモリ(メモリ構成)-----------------------------------
#
# Lock the memory on startup:
#
# bootstrap.memory_lock:true
#
# Make sure that the heap size is set to about half the memory available
# on the system and that the owner of the process is allowed to use this
# limit.
#
# Elasticsearch performs poorly when the system is swapping the memory.
#
# - - - - - - - - - - - - - - - - - - - - - - - - - - - - - - - - - - ネットワーク(ネットワーク構成)-----------------------------------
#
# Set the bind address to a specific IP(IPv4 or IPv6):
#
# network.host:192.168.0.1 #リスニングIPアドレスを構成する
#
# Set a custom port for HTTP:
#
# http.port:9200  #リスニングポートを構成する
#
# For more information, consult the network module documentation.
#
# - - - - - - - - - - - - - - - - - - - - - - - - - - - - - - - - - Discovery ----------------------------------
#
# Pass an initial list of hosts to perform discovery when newnode is started:
# The default list of hosts is ["127.0.0.1","[::1]"]
#
# discovery.zen.ping.unicast.hosts:["host1","host2"]
#
# Prevent the "split brain" by configuring the majority ofnodes(total number of master-eligible nodes /2+1):
#
# discovery.zen.minimum_master_nodes:3
#
# For more information, consult the zen discovery module documentation.
#
# - - - - - - - - - - - - - - - - - - - - - - - - - - - - - - - - - - Gateway -----------------------------------
#
# Block initial recovery after a full cluster restart until N nodes are started:
#
# gateway.recover_after_nodes:3
#
# For more information, consult the gateway module documentation.
#
# - - - - - - - - - - - - - - - - - - - - - - - - - - - - - - - - - - Various -----------------------------------
#
# Require explicit names when deleting indices:
#
# action.destructive_requires_name:true
3. Logstashのインストール構成####
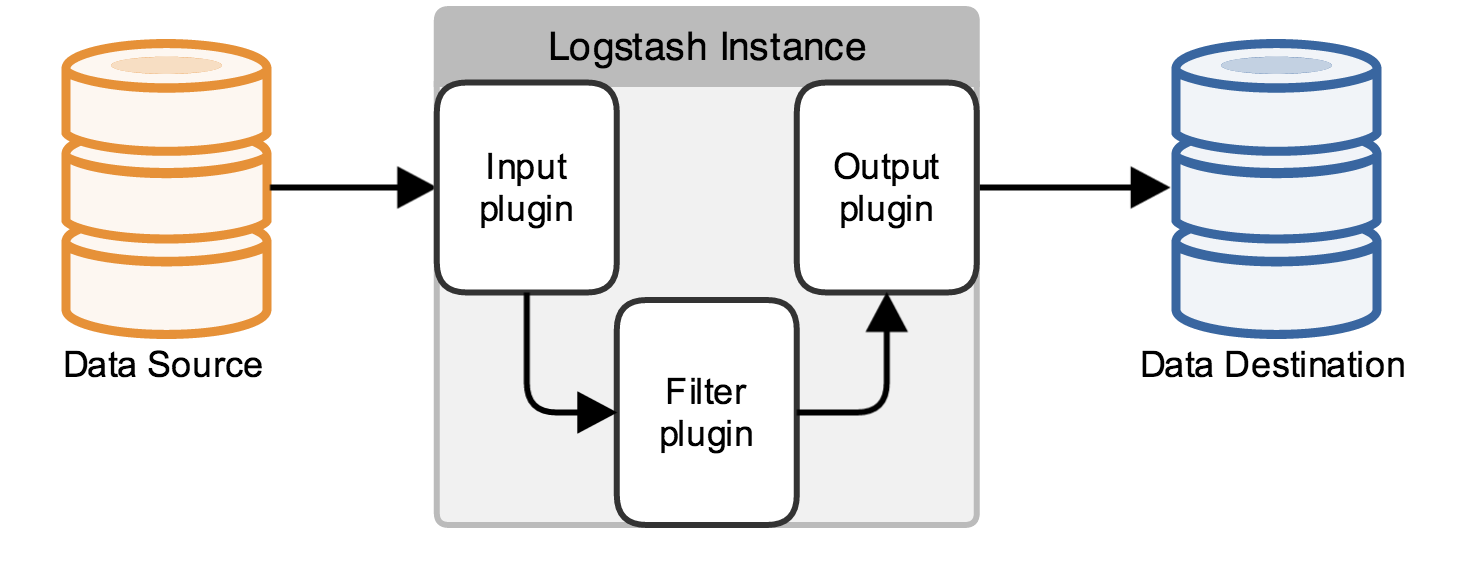
実際、これは単なるコレクターであり、入力と出力を指定する必要があります(もちろん、入力と出力は複数にすることができます)。 JavaコードのLog4jログをElasticSearchに出力する必要があるため、ここでの入力はLog4jであり、出力はElasticSearchです。
[ root@tokyo software]# rpm -ivh logstash-5.5.2.rpm
[ root@tokyo software]# vim /etc/logstash/conf.d/logstash-svr.conf #logstash構成ファイルを定義する
# ログソースを定義する
input {
 file {
 path =>["/data/wwwlogs/logstash_json.log"] #ログソースを定義する
 type =>"nginx"  #ログタイプを定義する
 codec => json  #ログのエンコード形式を定義する
  }}
# ログをフォーマットします(スライス)
filter {
 mutate {
  split =>["upstreamtime",","]}
 mutate {
  convert =>["upstreamtime","float"]}
 geoip {
  source =>"clientip"
  fields =>["ip","city_name","country_name"]}}
# ログの出力先を定義する
output {
 elasticsearch {
 hosts =>["localhost:9200"]
 index =>"logstash-%{+YYYY.MM.dd}"}}
構成が完了したら、logstashコマンドを使用して、構成ファイルが正しいかどうかをテストできます。
[ root@tokyo logstash]# ./bin/logstash -f /etc/logstash/conf.d/logstash-svr.conf
4. Kibanaのインストール構成####
[ root@tokyo software]# rpm -ivh kibana-5.5.2-x86_64.rpm
Kibanaは通常、状況に応じて3つの場所を構成します。次の構成を参照してください。
# server.port:5601 #キバナリスニングポートを設定する

# The URL of the Elasticsearch instance to use for all your queries.
# elasticsearch.url:"http://localhost:9200"
elasticsearch.url:"http://localhost:9200" #Elasticsearchのアドレスとポートを構成します

# xがインストールされている場合-パック(後で別途説明)の場合、elasticsearchアカウントのパスワードをここで構成する必要があります
# is proxied through the Kibana server.
# elasticsearch.username:"user"
# elasticsearch.password:"pass"
この時点で、http:// IP +5601を使用してkibanaにアクセスできるはずです。
結びの言葉###
スペースの制限により、この記事ではELKとELKのインストールと構成についてのみ紹介します。実際の作業では、これらは比較的自由に組み合わせることができますが、この記事では紹介していません。エルクと少し連絡を取りましたが、記事に誤りがありましたら、批判して訂正していただければ幸いです。
参考資料:
- IBMの公式:https://www.ibm.com/developerworks/cn/opensource/os-cn-elk/
- プログラミングを習慣にする:http://www.cnblogs.com/beautiful-code/p/6125584.html
- hello dog:https://wsgzao.github.io/post/elk/
Recommended Posts