CentOS7 builds ELK log centralized analysis platform
In the past, when operation and maintenance personnel analyzed logs, I believe that the most used method is to log in to the server one by one and use sed and awk tools to analyze, or use a shell script or Python script to analyze the logs. But this method is not only unintuitive, but also very inefficient. Usually, the logs are stored on different devices. If you manage dozens or hundreds of servers, then you have to play. Although there are automated tools like Ansible, they are not very efficient. It is imperative that we use centralized log management, such as open source syslog, to collect and summarize the logs on all servers. For example: open source syslog collects and summarizes the logs on all servers.
After centralized management of logs, log statistics and retrieval have become a more troublesome thing. Generally, we can use Linux commands such as grep, awk and wc to achieve retrieval and statistics, but for more demanding requirements such as query, sorting and statistics And the large number of machines still use this method inevitably a little bit powerless.
ELK introduction###
The open source real-time log analysis ELK platform can perfectly solve our above-mentioned problems. ELK is composed of three open source tools, ElasticSearch, Logstash and Kiabana. Official website: https://www.elastic.co/products
- Elasticsearch is an open source distributed search engine. Its characteristics are: distributed, zero configuration, automatic discovery, automatic index sharding, index copy mechanism, restful style interface, multiple data sources, automatic search load, etc.
- Logstash is a completely open source tool that can collect and filter your logs, and store them for later use (eg, search).
- Kibana is also an open source and free tool. Kibana can provide Logstash and ElasticSearch with a log analysis friendly Web interface that can help you summarize, analyze, and search for important data logs.
The figure below shows the working principle of elk:
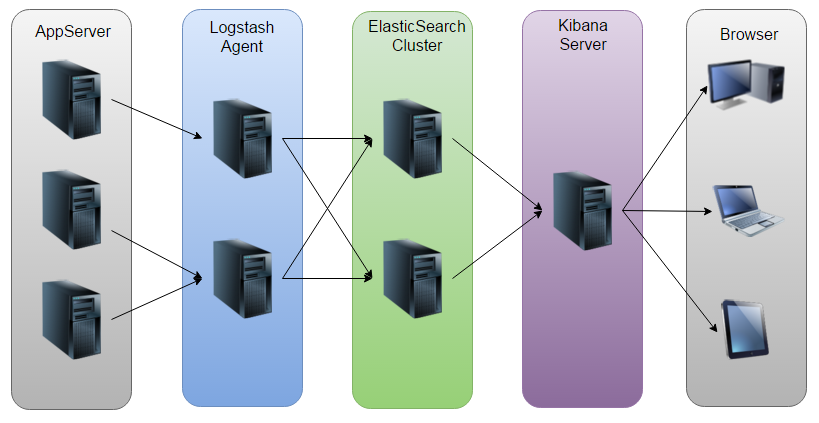
As shown in the figure: Logstash collects the Log generated by AppServer and stores it in the ElasticSearch cluster, while Kibana queries the data from the ES (or stand-alone) cluster to generate a graph, and then returns it to the Browser.
ELK platform construction###
Generally, the ELK platform is divided into a cluster and a single machine. Since the resources of the machine on hand are sufficient, the stand-alone construction is taken as an example in this article.
1. System environment####
- System: CentOS Linux release 7.1.1503 (Core)
- ElasticSearch: 5.5.2
- Logstash: 5.5.2
- Kibana: 5.5.2
- Java: openjdk version “1.8.0_141”
- Note: Since the operation of Logstash depends on the Java environment, and Logstash 1.5 or higher is not lower than Java 1.7, it is recommended to use the latest version of Java. Because we only need the Java operating environment, we can only install JRE, but I still use JDK here, please search and install it yourself. *
2. ELK software download####
[ root@tokyo software]# ls
elasticsearch-5.5.2.rpm  kibana-5.5.2-x86_64.rpm  logstash-5.5.2.rpm
3. Elasticsearch installation configuration####
[ root@tokyo software]# rpm -ivh elasticsearch-5.5.2.rpm
[ root@tokyo software]# vim /etc/elasticsearch/elasticsearch.yml  #Elasticsearch main configuration file
# - - - - - - - - - - - - - - - - - - - - - - - - - - - - - - - - - - Cluster (cluster configuration)-----------------------------------
#
# Use a descriptive name for your cluster:
#
# cluster.name: my-application  #Cluster name
# - - - - - - - - - - - - - - - - - - - - - - - - - - - - - - - - - - - - Node (node configuration)------------------------------------
#
# Use a descriptive name for the node:
#
# node.name: node-1  #Node name
#
# Add custom attributes to the node:
#
# node.attr.rack: r1
# - - - - - - - - - - - - - - - - - - - - - - - - - - - - - - - - - - - Paths (directory path configuration)------------------------------------
#
# Path to directory where to store the data(separate multiple locations by comma):
#
# path.data:/path/to/data #Data storage directory
#
# Path to log files:
#
# path.logs:/path/to/logs #Log storage directory
#
# - - - - - - - - - - - - - - - - - - - - - - - - - - - - - - - - - - - Memory (Memory Configuration)-----------------------------------
#
# Lock the memory on startup:
#
# bootstrap.memory_lock:true
#
# Make sure that the heap size is set to about half the memory available
# on the system and that the owner of the process is allowed to use this
# limit.
#
# Elasticsearch performs poorly when the system is swapping the memory.
#
# - - - - - - - - - - - - - - - - - - - - - - - - - - - - - - - - - - Network (Network Configuration)-----------------------------------
#
# Set the bind address to a specific IP(IPv4 or IPv6):
#
# network.host:192.168.0.1 #Configure listening IP address
#
# Set a custom port for HTTP:
#
# http.port:9200  #Configure listening port
#
# For more information, consult the network module documentation.
#
# - - - - - - - - - - - - - - - - - - - - - - - - - - - - - - - - - Discovery ----------------------------------
#
# Pass an initial list of hosts to perform discovery when newnode is started:
# The default list of hosts is ["127.0.0.1","[::1]"]
#
# discovery.zen.ping.unicast.hosts:["host1","host2"]
#
# Prevent the "split brain" by configuring the majority ofnodes(total number of master-eligible nodes /2+1):
#
# discovery.zen.minimum_master_nodes:3
#
# For more information, consult the zen discovery module documentation.
#
# - - - - - - - - - - - - - - - - - - - - - - - - - - - - - - - - - - Gateway -----------------------------------
#
# Block initial recovery after a full cluster restart until N nodes are started:
#
# gateway.recover_after_nodes:3
#
# For more information, consult the gateway module documentation.
#
# - - - - - - - - - - - - - - - - - - - - - - - - - - - - - - - - - - Various -----------------------------------
#
# Require explicit names when deleting indices:
#
# action.destructive_requires_name:true
3. Logstash installation configuration####
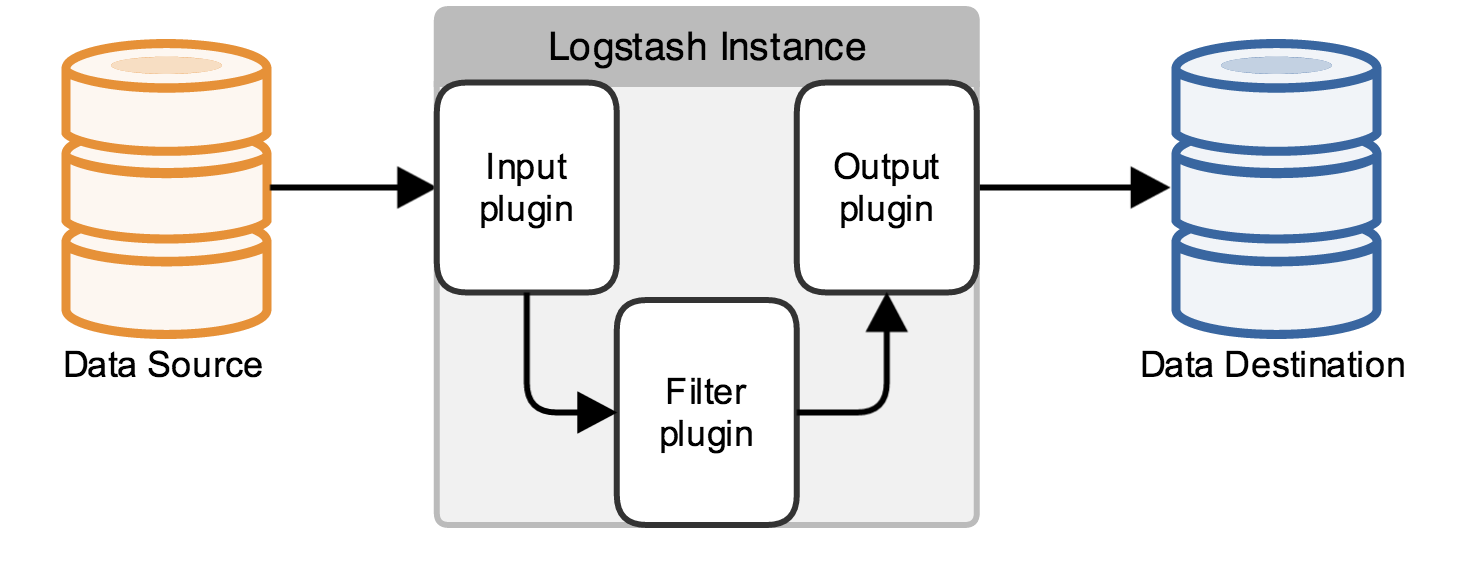
In fact, it is just a collector, we need to specify Input and Output for it (Of course Input and Output can be multiple). Since we need to output the Log4j log in the Java code to ElasticSearch, the Input here is Log4j, and the Output is ElasticSearch.
[ root@tokyo software]# rpm -ivh logstash-5.5.2.rpm
[ root@tokyo software]# vim /etc/logstash/conf.d/logstash-svr.conf #Define logstash configuration file
# Define the log source
input {
 file {
 path =>["/data/wwwlogs/logstash_json.log"] #Define the log source
 type =>"nginx"  #Define log type
 codec => json  #Define the log encoding format
  }}
# Format the log(slice)
filter {
 mutate {
  split =>["upstreamtime",","]}
 mutate {
  convert =>["upstreamtime","float"]}
 geoip {
  source =>"clientip"
  fields =>["ip","city_name","country_name"]}}
# Define the log output destination
output {
 elasticsearch {
 hosts =>["localhost:9200"]
 index =>"logstash-%{+YYYY.MM.dd}"}}
After the configuration is complete, you can use the logstash command to test whether the configuration file is correct.
[ root@tokyo logstash]# ./bin/logstash -f /etc/logstash/conf.d/logstash-svr.conf
4. Kibana installation configuration####
[ root@tokyo software]# rpm -ivh kibana-5.5.2-x86_64.rpm
Kibana generally configures three places, according to your own situation, refer to the following configuration.
# server.port:5601 #Configure kibana listening port

# The URL of the Elasticsearch instance to use for all your queries.
# elasticsearch.url:"http://localhost:9200"
elasticsearch.url:"http://localhost:9200" #Configure the address and port of elasticsearch

# If x is installed-For pack (said separately later), you need to configure the elasticsearch account password here
# is proxied through the Kibana server.
# elasticsearch.username:"user"
# elasticsearch.password:"pass"
At this moment, you should be able to access kibana using http://IP+5601.
Concluding remarks###
Due to space limitations, this article only introduces the installation and configuration of ELK and ELK. In actual work, they can be combined relatively freely. These are not introduced in this article. I have just been in contact with elk for a short time. If there is any fallacy in the article, I hope you can criticize and correct me.
Reference materials:
- IBM official: https://www.ibm.com/developerworks/cn/opensource/os-cn-elk/
- Make programming a habit: http://www.cnblogs.com/beautiful-code/p/6125584.html
- hello dog:https://wsgzao.github.io/post/elk/