Introduce several Python performance optimization tools
Hi everyone, and welcome to Crossin's programming classroom!
Although many people think that Python is a "slow" language, in fact, in many cases, the reason for the slow program is not the language pot, but the code is not well written. Therefore, during the running of the program, if you find that the running time is too long or the memory usage is too large, you need to monitor the execution of the program to find the problematic area and optimize it. Today we will share some Python performance analysis tools that can be used in daily life.
memory_profiler
memory_profiler is an artifact to monitor the python process, you only need to add a decorator to the function to output the memory usage of each line of code
installation:
pip install memory_profiler
use:
import time

@ profile
def my_func():
 a =[1]*(10**6)
 b =[2]*(2*10**7)
 time.sleep(10)
 del b
 del a
 print "+++++++++"if __name__ =='__main__':my_func()
Output:
$ python -m memory_profiler del3.py
+++++++++
Filename: del3.py

Line #    Mem usage    Increment   Line Contents
================================================10.293 MiB    0.000 MiB   @profile
       def my_func():17.934 MiB    7.641 MiB       a =[1]*(10**6)170.523 MiB  152.590 MiB       b =[2]*(2*10**7)170.527 MiB    0.004 MiB       time.sleep(10)17.938 MiB -152.590 MiB       del b
 10.305 MiB   -7.633 MiB       del a
 10.309 MiB    0.004 MiB       print "+++++++++"
Built-in function timeit
import timeit
import time

def my_func():
 time.sleep(1)returnsum([1,2,3])

result = timeit.timeit(my_func, number=5)print(result)
Jupyter Notebook Magic Command
In Jupyter Notebook, you can use the %%timeit magic command to test the running time of the code in the cell
%%timeit

import time
def my_func():
 time.sleep(1)returnsum([1,2,3])

result = timeit.timeit(my_func, number=5)print(result)
Timing decorator
Decorators in Python can add additional functions without changing any code in other functions, and are often used in scenarios such as inserting logs, performance testing, and permission verification. We can encapsulate the timing function into a decorator for easy reuse.
from functools import wraps
import time

def timeit(func):
 @ wraps(func)
 def deco():
  start = time.time()
  res =func()
  end = time.time()
  delta = end - start
  print("Wall time ", delta)return res
 return deco
use:
@ timeit
def my_func():
 # do something
 time.sleep(3)
 pass
Output:
Wall time:3
line_profiler
If we not only want to know the overall running time of the code, but also accurately analyze the running time of each line of code, then python's line_profiler module can help you! line_profiler can be used to test the response time of each line of code of the function, etc. For ease of use, the line_profiler related functions can be encapsulated in a decorator for use, so that when the interface requests, the decorator will be executed and the result will be printed.
installation:
pip install line_profiler
use:
from flask import Flask, jsonify
import time
from functools import wraps
from line_profiler import LineProfiler

# Query the execution time of each line of code in the interface
def func_line_time(f):
 @ wraps(f)
 def decorator(*args,**kwargs):
  func_return =f(*args,**kwargs)
  lp =LineProfiler()
  lp_wrap =lp(f)lp_wrap(*args,**kwargs)
  lp.print_stats()return func_return
 return decorator

app =Flask(__name__)

@ app.route('/line_test')
@ func_line_time
def line_test():for item inrange(5):
  time.sleep(1)for item inxrange(5):
  time.sleep(0.5)returnjsonify({'code':200})if __name__=='__main__':
app.run()
Output:
* Running on http://127.0.0.1:5000/
Timer unit:1e-06 s

Total time:7.50827 s
File:/home/rgc/baidu_eye/carrier/test/flask_line_profiler_test.py
Function: line_test at line 22

Line #      Hits         Time  Per Hit   % Time  Line Contents
==============================================================
           @ app.route('/line_test')
           @ func_line_time
           def line_test():633.05.50.0for item inrange(5):55005225.01001045.066.7          time.sleep(1)631.05.20.0for item inxrange(5):52502696.0500539.233.3          time.sleep(0.5)1282.0282.00.0returnjsonify({'code':200})127.0.0.1--[05/Mar/201815:58:21]"GET /line_test HTTP/1.1"200-
pyheat
Compared with the above code running time test tool, pyheat shows the running time of the code through matplotlib drawing heat map, which is more intuitive
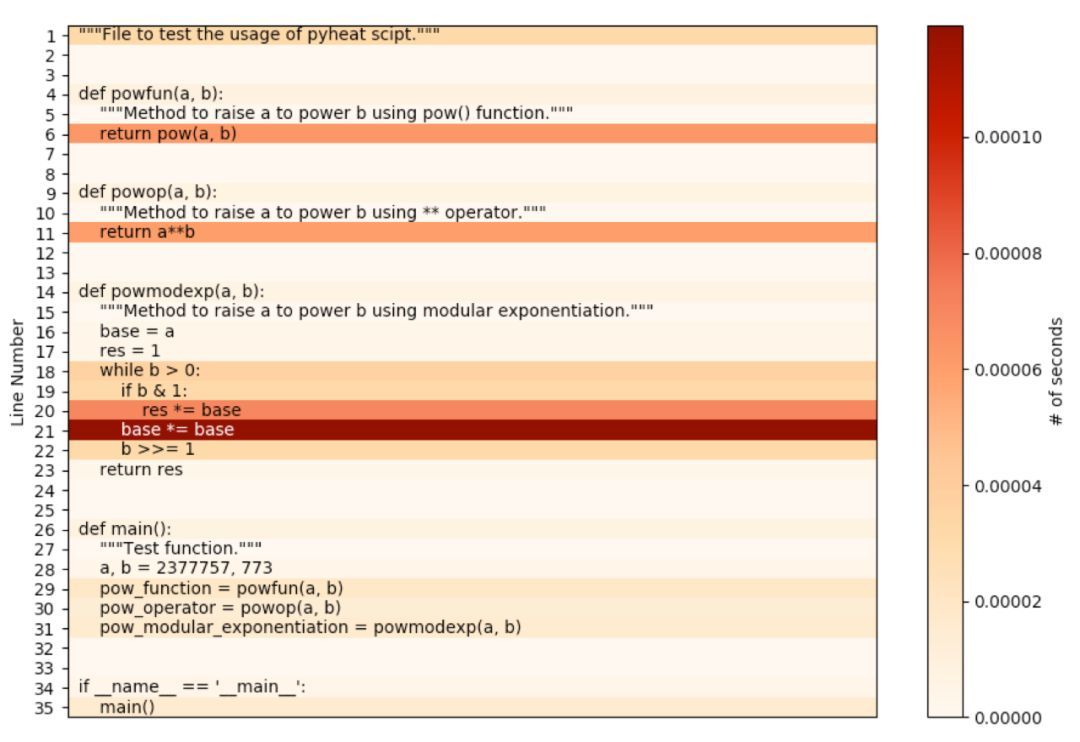
installation:
pip install py-heat
Instructions:
pyheat <path_to_python_file>--out image_file.png
heartrate
heartrate is also a visual monitoring tool, which can track the running of the program like monitoring the heart rate, and visualize the execution process of the Python program through the web page.
img
The number on the left indicates the number of times each line of code was triggered. The long box indicates the code line that has been triggered recently-the longer the box, the more the number of triggers, and the lighter the color, the more recently it has been triggered. The tool records the number of executions of each line of code,
Rather than the specific execution time, it is a bit tasteless during performance debugging
installation:
pip install --user heartrate
use:
import heartrate
from heartrate import trace, files

heartrate.trace(browser=True)trace(files=files.path_contains('my_app','my_library'))
The above are several commonly used Python performance optimization tools. But the tool is only an aid, the core still needs to write the code to have the awareness of code optimization and a deep understanding of the language and code. This is a long-term accumulation process. Keep reading and writing code, your code performance will naturally continue to improve with your ability!