Python描画|さまざまな台風経路の視覚化方法
台風は大きな壊滅的な天候です。台風によって引き起こされる直接的な災害は、通常、スコール、大雨、暴風雨の3つの側面によって引き起こされます。さらに、これらの台風の災害は、都市の浸水、家屋の崩壊、山の急流、土砂崩れ、その他の二次的な災害を簡単に引き起こす可能性があります。このため、台風は科学研究やビジネスの研究の焦点です。この台風の道の視覚化があなたに少しの助けになることを願っています。
台風経路の取得
中国気象局(CMA)
中国気象局(CMA)の最高の台風経路データセット(BST)。BSTは、過去の台風経路の修正後にリリースされます。緯度、経度、強度、圧力の信頼性は高くなりますが、時間分解能は6時間です。 、パート3時間、これは観測データほど良くありません。ダウンロードリンク:http://tcdata.typhoon.org.cn/
文州台風ネットワーク
Wenzhou Typhoon Networkのデータは、最大1時間の時間分解能と、台風の軌跡のより洗練された表現を備えた、リアルタイムのリリースデータの記録です。ダウンロードリンク:http://www.wztf121.com/
例
モジュールをインポートし、BSTの2018台風パスデータを例として使用してデータを読み取ります。元のtxtファイルはxlsファイルに変換されています。
import os, glob
import pandas as pd
import numpy as np
import shapely.geometry as sgeom
import matplotlib.pyplot as plt
from matplotlib.image import imread
from matplotlib.animation import FuncAnimation
import matplotlib.lines as mlines
import cartopy.crs as ccrs
import cartopy.feature as cfeat
from cartopy.mpl.ticker import LongitudeFormatter,LatitudeFormatter
import cartopy.io.shapereader as shpreader
import cartopy.io.img_tiles as cimgt
from PIL import Image
import warnings
warnings.filterwarnings('ignore')
df = pd.read_csv('./2018typhoon.csv')
グレードのカラーコードを定義する
def get_color(level):
 global color
 if level =='熱帯うつ病' or level =='熱帯の混乱':
  color='#FFFF00'
 elif level =='熱帯の嵐':
  color='#6495ED'
 elif level =='激しい熱帯の嵐':
  color='#3CB371'
 elif level =='台風':
  color='#FFA500'
 elif level =='強い台風':
  color='#FF00FF'
 elif level =='スーパー台風':
  color='#DC143C'return color
ベースマップ関数を定義する
def create_map(title, extent):
 fig = plt.figure(figsize=(12,8))
 ax = fig.add_subplot(1,1,1, projection=ccrs.PlateCarree())
 url ='http://map1c.vis.earthdata.nasa.gov/wmts-geo/wmts.cgi'
 layer ='BlueMarble_ShadedRelief'
 ax.add_wmts(url, layer)
 ax.set_extent(extent,crs=ccrs.PlateCarree())

 gl = ax.gridlines(draw_labels=False, linewidth=1, color='k', alpha=0.5, linestyle='--')
 gl.xlabels_top = gl.ylabels_right = False
 ax.set_xticks(np.arange(extent[0], extent[1]+5,5))
 ax.set_yticks(np.arange(extent[2], extent[3]+5,5))
 ax.xaxis.set_major_formatter(LongitudeFormatter())
 ax.xaxis.set_minor_locator(plt.MultipleLocator(1))
 ax.yaxis.set_major_formatter(LatitudeFormatter())
 ax.yaxis.set_minor_locator(plt.MultipleLocator(1))
 ax.tick_params(axis='both', labelsize=10, direction='out')

 a = mlines.Line2D([],[],color='#FFFF00',marker='o',markersize=7, label='TD',ls='')
 b = mlines.Line2D([],[],color='#6495ED', marker='o',markersize=7, label='TS',ls='')
 c = mlines.Line2D([],[],color='#3CB371', marker='o',markersize=7, label='STS',ls='')
 d = mlines.Line2D([],[],color='#FFA500', marker='o',markersize=7, label='TY',ls='')
 e = mlines.Line2D([],[],color='#FF00FF', marker='o',markersize=7, label='STY',ls='')
 f = mlines.Line2D([],[],color='#DC143C', marker='o',markersize=7, label='SSTY',ls='')
 ax.legend(handles=[a,b,c,d,e,f], numpoints=1, handletextpad=0, loc='upper left', shadow=True)
 plt.title(f'{title} Typhoon Track', fontsize=15)return ax
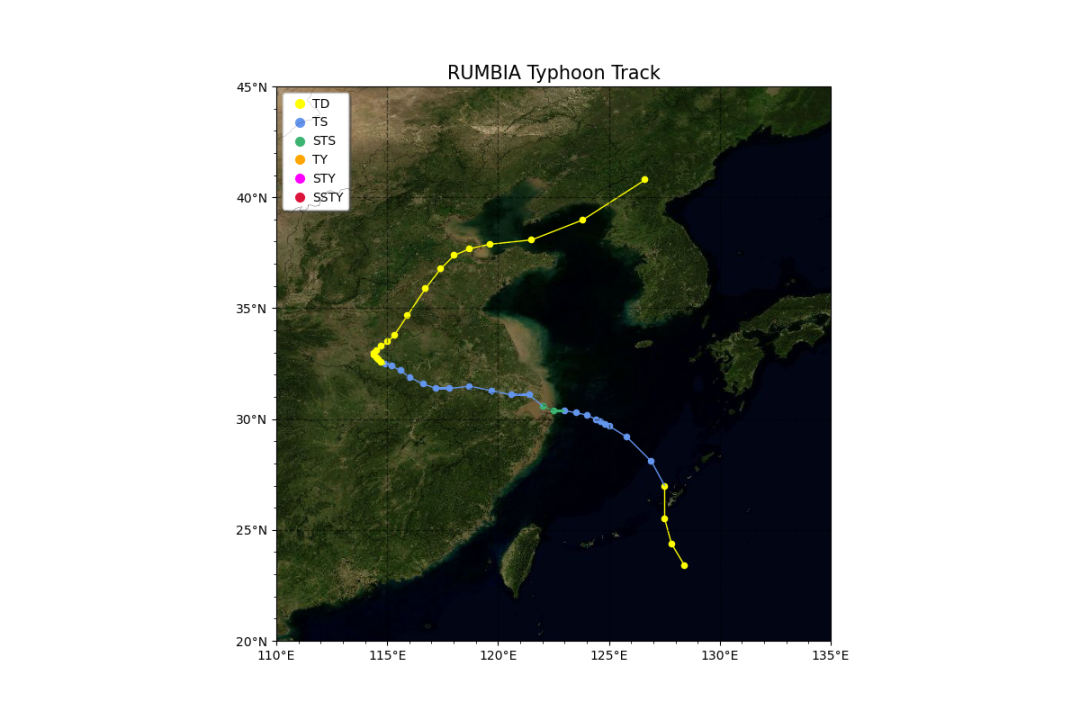
単一の台風の経路を描く方法を定義し、2018年に18番目の台風ウンビアを描きます。
def draw_single(df):
 ax =create_map(df['ファーストネーム'].iloc[0],[110,135,20,45])for i inrange(len(df)):
  ax.scatter(list(df['経度'])[i],list(df['緯度'])[i], marker='o', s=20, color=get_color(list(df['力'])[i]))for i inrange(len(df)-1):
  pointA =list(df['経度'])[i],list(df['緯度'])[i]
  pointB =list(df['経度'])[i+1],list(df['緯度'])[i+1]
  ax.add_geometries([sgeom.LineString([pointA, pointB])], color=get_color(list(df['力'])[i+1]),crs=ccrs.PlateCarree())
 plt.savefig('./typhoon_one.png')draw_single(df[df['ナンバリング']==1818])
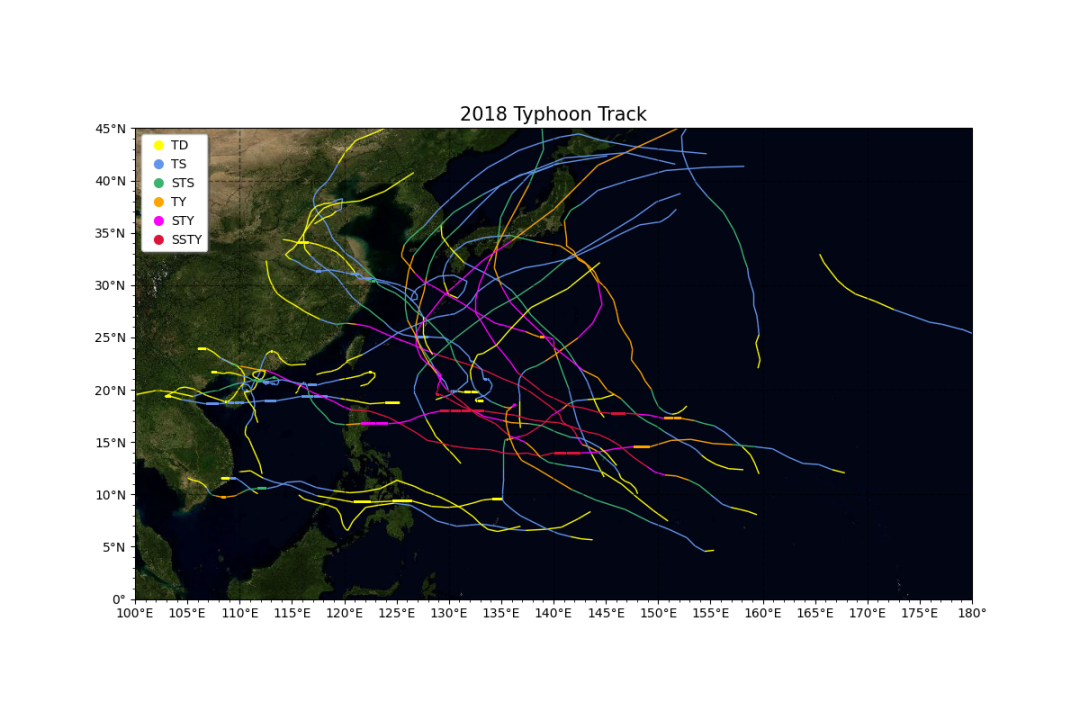
複数の台風経路を描画する方法を定義し、2018年を通してすべての台風経路を描画します。
def draw_multi(df):
 L =list(set(df['ナンバリング']))
 L.sort(key=list(df['ナンバリング']).index)
 ax =create_map('2018',[100,180,0,45])for number in L:
  df1 = df[df['ナンバリング']==number]for i inrange(len(df1)-1):
   pointA =list(df1['経度'])[i],list(df1['緯度'])[i]
   pointB =list(df1['経度'])[i+1],list(df1['緯度'])[i+1]
   ax.add_geometries([sgeom.LineString([pointA, pointB])], color=get_color(list(df1['力'])[i+1]),crs=ccrs.PlateCarree())
 plt.savefig('./typhoon_multi.png')draw_multi(df)
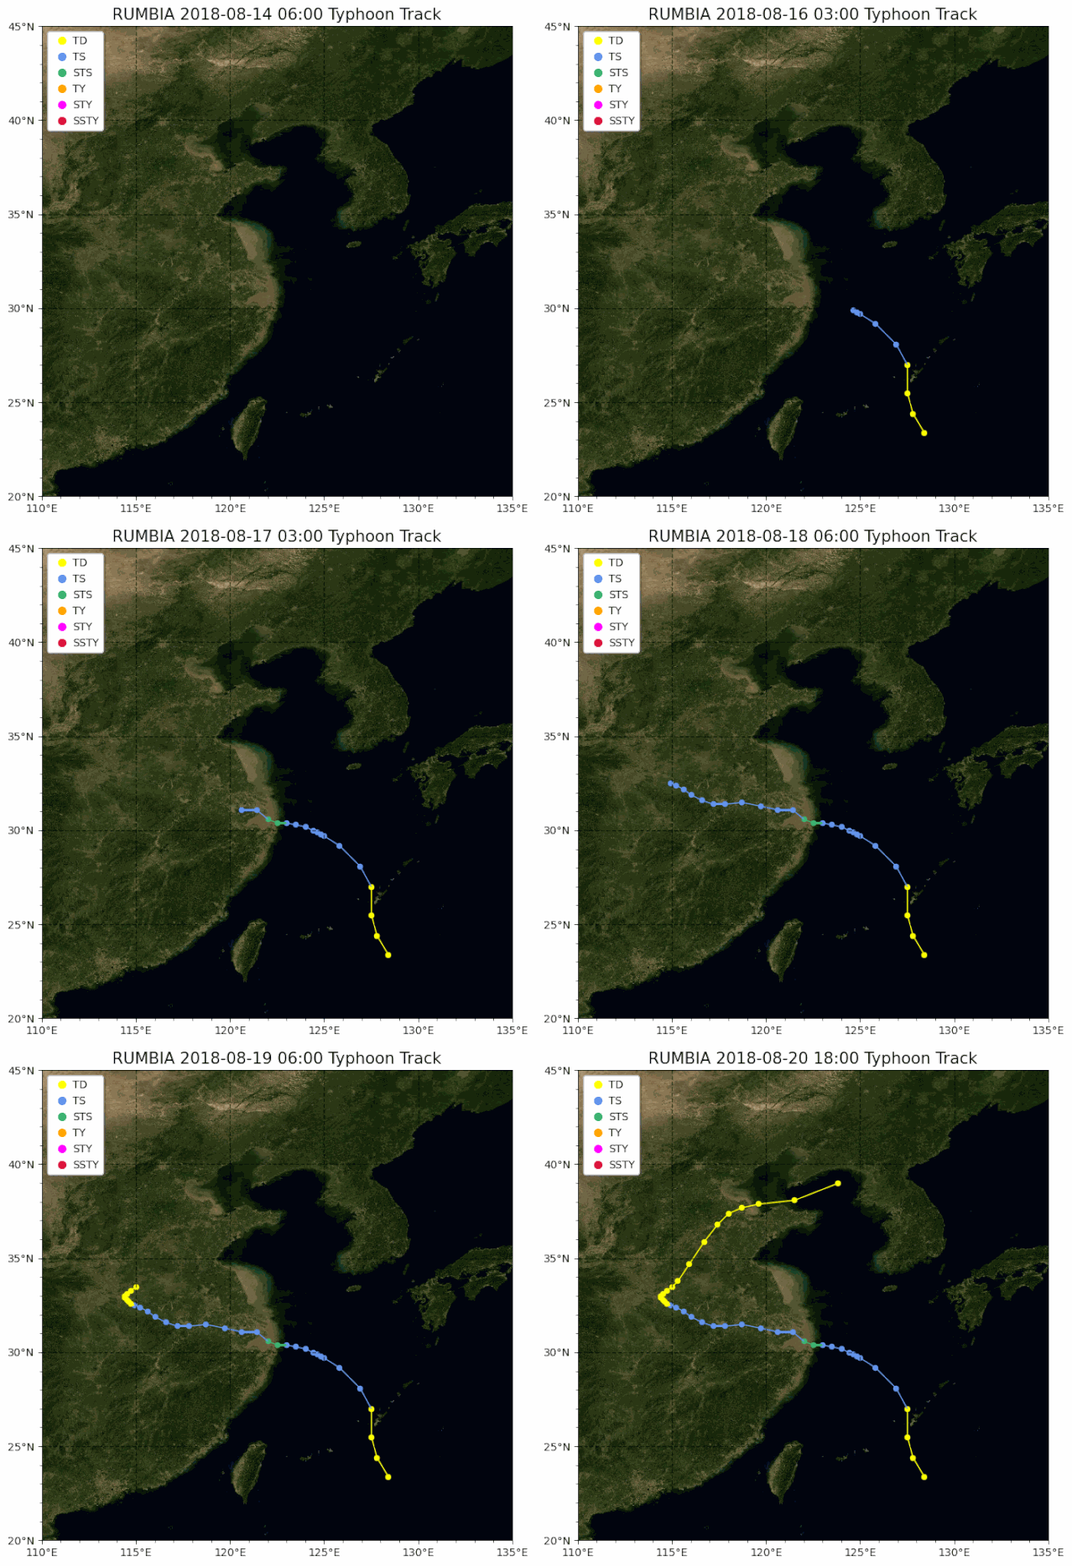
単一の台風gifパスを描画する進化方法を定義し、2018年の台風No.18のgifパスマップを描画します。
def draw_single_gif(df):for state inrange(len(df.index))[:]:
  ax =create_map(f'{df["ファーストネーム"].iloc[0]} {df["時間"].iloc[state]}',[110,135,20,45])for i inrange(len(df[:state])):
   ax.scatter(df['経度'].iloc[i], df['緯度'].iloc[i], marker='o', s=20, color=get_color(df['力'].iloc[i]))for i inrange(len(df[:state])-1):
   pointA = df['経度'].iloc[i],df['緯度'].iloc[i]
   pointB = df['経度'].iloc[i+1],df['緯度'].iloc[i+1]
   ax.add_geometries([sgeom.LineString([pointA, pointB])], color=get_color(df['力'].iloc[i+1]),crs=ccrs.PlateCarree())print(f'図{state}軌道グラフ')
  plt.savefig(f'./{df["ファーストネーム"].iloc[0]}{str(state).zfill(3)}.png', bbox_inches='tight')
 # 写真をアニメーションにステッチする
 imgFiles =list(glob.glob(f'./{df["ファーストネーム"].iloc[0]}*.png'))
 images =[Image.open(fn)for fn in imgFiles]
 im = images[0]
 filename = f'./track_{df["ファーストネーム"].iloc[0]}.gif'
 im.save(fp=filename, format='gif', save_all=True, append_images=images[1:], duration=500)draw_single_gif(df[df['ナンバリング']==1818])
取得する方法 ##
サンプルデータ、コード、および写真が取得され、**「CuriosityLog」**の背景にメッセージを残します公式アカウント:Typhoon Path

txtデータをxlsに変換するスクリプトは、自分で作成できます。複雑ではありません。このスクリプトが本当に必要な場合は、この記事をMomentsに送信し、スクリーンショットを背景に送信してください。
オリジナルになるのは簡単ではありません。この記事がとても役立つと思うなら、あなたが素敵なら読んでそして再投稿していただければ幸いです。


[ python描画| python共通視覚化をマスターするための7つのカテゴリの50の詳細な例](http://mp.weixin.qq.com/s?__biz=MzA3MDQ1NDA4Mw==&mid=2247488133&idx=1&sn=7b5eb89d96166dd73ff8710696963566&chksm=9f3dcca9a349afec15c
[ 天気と天気データのウェブサイトの収集、および.ncデータのオープン方法](http://mp.weixin.qq.com/s?__biz=MzA3MDQ1NDA4Mw==&mid=2247488133&idx=3&sn=ea45b509bf31ae033269fe87decc8a6c&chksm43b194d2e87

[ 大学院研究と気象学専攻の講師の選択に関するいくつかの提案](http://mp.weixin.qq.com/s?__biz=MzA3MDQ1NDA4Mw==&mid=2247488147&idx=1&sn=6a08a078587e34e156174a226ea7d783&chksm=9f3dccb
[ モデルによって予測される将来の気候変動シナリオは信頼できますか? ](http://mp.weixin.qq.com/s?__biz=MzA3MDQ1NDA4Mw==&mid=2247487361&idx=1&sn=4345383e902bfe873b968ac04870fce6&chksm=9f3dd1ada84a58bb77582fe601453e7d02e87e5092904
Recommended Posts