Pythonの視覚化| SeabornEconomistの古典的なチャートの模倣
以前の元のツイートでは、R-ggplot2を使用してエコノミストのクラシックチャート模倣を実装しました[R-ggplot2クラシックエコノミストチャート模倣](https://mp.weixin.qq.com/s?__biz=MzA5ODk0NjA1Mg==&mid=2247487123&idx=1&sn=eea673b909d6614c3b49df83e197d367&chksm=908893f8a7ff1aee151cd4a67ee6858544e1bf65340b21896fba56195f13b5345d42fe936f01&token=858653938&lang=zh_CN&scene=21#wechat_redirect)。したがって、この号では、Python-seabornを使用してこのクラシックを実装します。エコノミストチャートが再び表示されます。関連する主な知識ポイントは次のとおりです。
- Python-seabornregplot回帰線形フィッティンググラフの描画
- matplotlib描画凡例のカスタマイズされた描画
- AdjustTextライブラリはテキスト回避の追加を実装します
Python-seabornはフィットライングラフを描画します
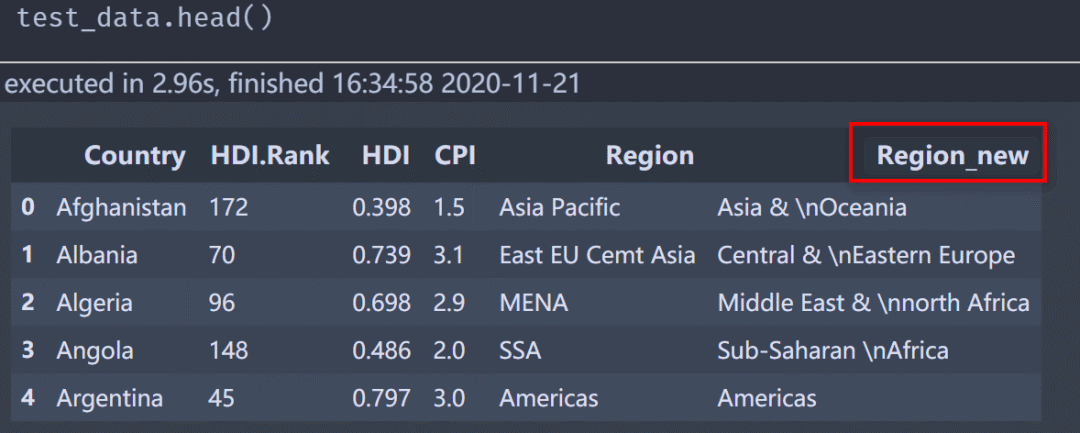
まず、データをプレビューします(部分的):

Region_new列は、関連する要件に応じて変更された新しい列であり、図面も2次データに基づいています。
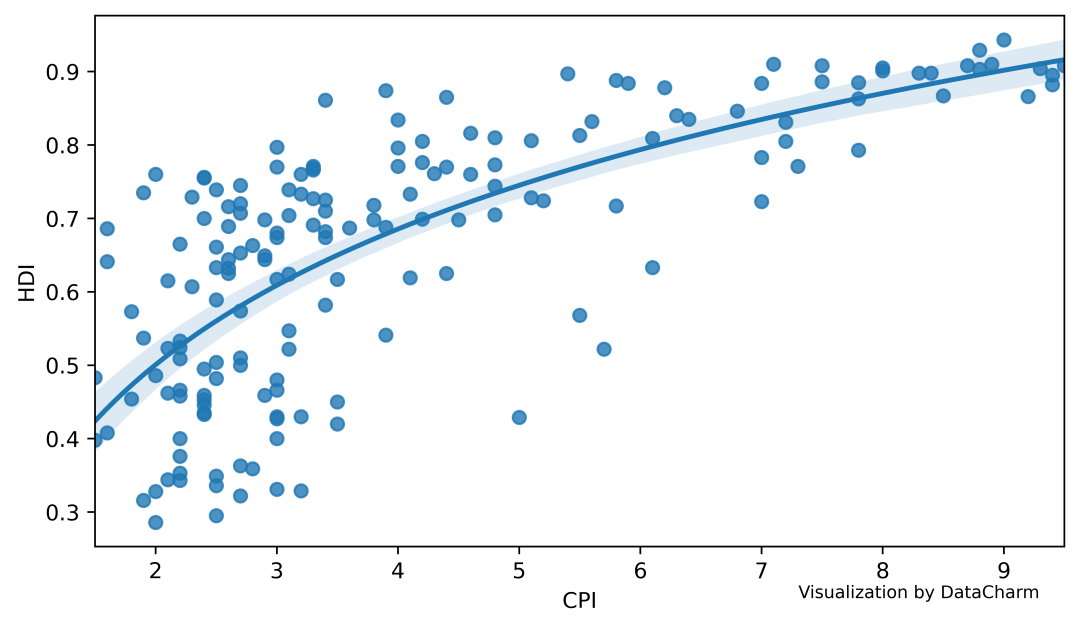
seabornを使用してフィッティングラインを描画すると、自分でホイールを繰り返すことを回避できます。次に、最も基本的な(変更なしで)直接描画します。コードは次のとおりです。
fig,ax = plt.subplots(figsize=(8,4.5),dpi=200,facecolor='white',edgecolor='white')
ax.set_facecolor("white")
fit_line = sns.regplot(data=test_data,x="CPI",y="HDI",logx=True,ax=ax)

ax.text(.85,-.07,'\nVisualization by DataCharm',transform = ax.transAxes,
  ha='center', va='center',fontsize =8,color='black')
視覚化効果は次のとおりです。

ここで必要な主なパラメータは次のとおりです。
- logx:対数フィッティング曲線を描画するために使用されます。デフォルトはFalseです。つまり、線形フィッティングラインが描画されます。
- ci:近似曲線を描画するための信頼区間。整数(0〜100)にすることも、Falseに設定することもできます。つまり、信頼区間は描画されません。
- { scatter、line} _kws:辞書タイプ。色、サイズ、太さなど、ポイントとラインの描画属性をカスタマイズできます。
現在、これらのみが導入されています(描画が必要なため)。詳細については、対応する公式Webサイトseaborn.regplotを参照してください。
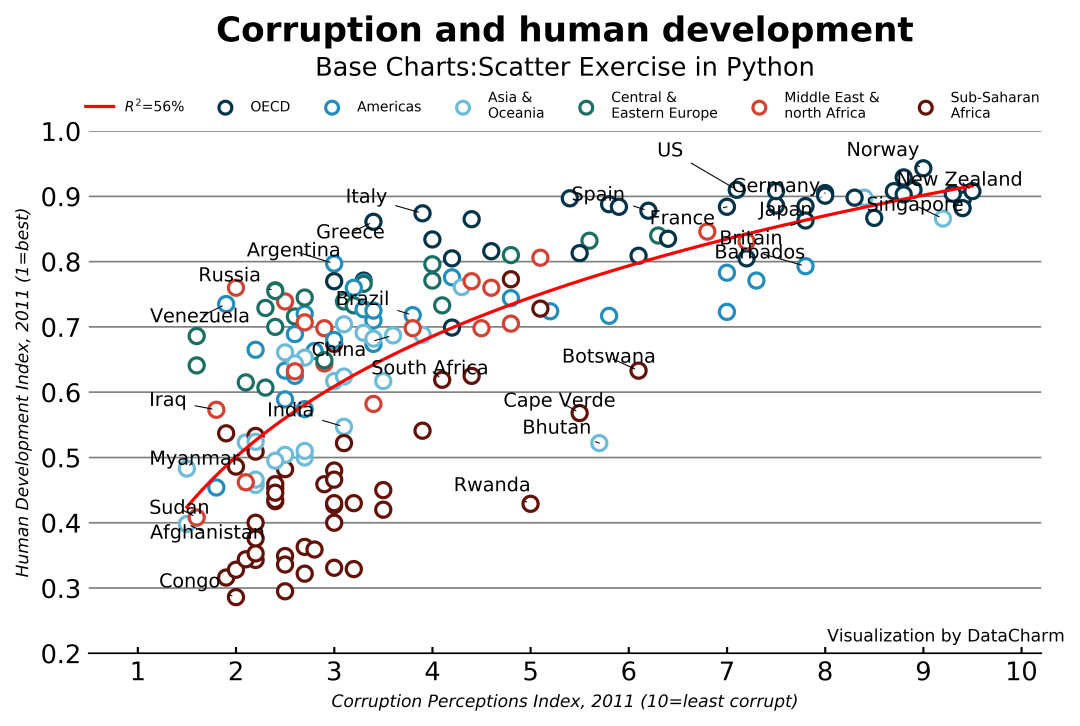
描画した視覚化コードを直接配置し、個別に説明します。コードは次のとおりです。
fig,ax = plt.subplots(figsize=(8,4.5),dpi=200,facecolor='white',edgecolor='white')
ax.set_facecolor("white")

color =[region_color[i]for i in test_data['Region_new']]

fit_line = sns.regplot(data=test_data,x="CPI",y="HDI",logx=True,ci=False,
      line_kws={"color":"red","label":r"$R^2$=56%","lw":1.5},
      scatter_kws={"s":50,"fc":"white","ec":color,"lw":1.5,"alpha":1},
      ax=ax)

texts =[]for i, j ,t  inzip(data_text["CPI"],data_text["HDI"],data_text["Country"]):
 texts.append(ax.annotate(t,xy=(i, j),xytext=(i-.8,j),
        arrowprops=dict(arrowstyle="-", color="black",lw=.5),
        color='black',size=9))adjust_text(texts,only_move={'text':'xy','objects':'x','point':'y'})
# adjust_text(texts,only_move={'text':'xy'})

ax.set_xlabel("Corruption Perceptions Index, 2011 (10=least corrupt)",fontstyle="italic",
    fontsize=8)

ax.set_ylabel("Human Development Index, 2011 (1=best)",fontstyle="italic",fontsize=8)

ax.set_xlim((.5,10.2))
ax.set_ylim((.2,1))
ax.set_xticks(np.arange(1,10.3, step=1))
ax.set_yticks(np.arange(0.2,1.05, step=0.1))

# グリッド設定
ax.grid(which='major',axis='y',ls='-',c='gray',)
ax.set_axisbelow(True)
# シャフトリッジ設定
for spine in['top','left','right']:
 ax.spines[spine].set_visible(None) #隠されたアキシャルリッジ
ax.spines['bottom'].set_color('k') #ボトムカラーを設定
# スケール設定は、一番下のスケールのみを表示し、方向は外側で、長さと幅も設定されます
ax.tick_params(bottom=True,direction='in',labelsize=12,width=1,length=3,
    left=False)

# 凡例を追加
ax.scatter([],[], ec='#01344A', fc="white",label='OECD', lw=1.5)
ax.scatter([],[], ec='#228DBD', fc="white",label='Americas', lw=1.5)
ax.scatter([],[], ec='#6DBBD8', fc="white",label='Asia & \nOceania', lw=1.5)
ax.scatter([],[], ec='#1B6E64', fc="white",label='Central & \nEastern Europe', lw=1.5)
ax.scatter([],[], ec='#D24131', fc="white",label='Middle East & \nnorth Africa', lw=1.5)
ax.scatter([],[], ec='#621107', fc="white",label='Sub-Saharan \nAfrica', lw=1.5)
ax.legend(loc="upper center",frameon=False,ncol=7,fontsize=6.5,bbox_to_anchor=(0.5,1.1))

ax.text(.5,1.19,"Corruption and human development",transform = ax.transAxes,ha='center',
  va='center',fontweight="bold",fontsize=16)

ax.text(.5,1.12,"Base Charts:Scatter Exercise in Python",
  transform = ax.transAxes,ha='center', va='center',fontsize =12,color='black')
ax.text(.9,.05,'\nVisualization by DataCharm',transform = ax.transAxes,
  ha='center', va='center',fontsize =8,color='black')
「ナレッジポイント」
- 散乱色の割り当てを容易にするカラーディクショナリの構築
color =('#01344A','#228DBD','#6DBBD8','#1B6E64','#D24131','#621107')
region =("OECD","Americas","Asia & \nOceania","Central & \nEastern Europe","Middle East & \nnorth Africa","Sub-Saharan \nAfrica")
region_color =dict(zip(region,color))

color =[region_color[i]for i in test_data['Region_new']]

# regplotで()次のように呼び出します
scatter_kws={"s":50,"fc":"white","ec":color,"lw":1.5,"alpha":1}
- ax.annotate属性を追加するadjust_text()メソッド
texts =[]for i, j ,t  inzip(data_text["CPI"],data_text["HDI"],data_text["Country"]):
 texts.append(ax.annotate(t,xy=(i, j),xytext=(i-.8,j),
        arrowprops=dict(arrowstyle="-", color="black",lw=.5),
        color='black',size=9))adjust_text(texts,only_move={'text':'xy','objects':'x','point':'y'})
- matplotlibのカスタマイズされた凡例設定
# 凡例を追加
ax.scatter([],[], ec='#01344A', fc="white",label='OECD', lw=1.5)
ax.scatter([],[], ec='#228DBD', fc="white",label='Americas', lw=1.5)
ax.scatter([],[], ec='#6DBBD8', fc="white",label='Asia & \nOceania', lw=1.5)
ax.scatter([],[], ec='#1B6E64', fc="white",label='Central & \nEastern Europe', lw=1.5)
ax.scatter([],[], ec='#D24131', fc="white",label='Middle East & \nnorth Africa', lw=1.5)
ax.scatter([],[], ec='#621107', fc="white",label='Sub-Saharan \nAfrica', lw=1.5)
ax.legend(loc="upper center",frameon=False,ncol=7,fontsize=6.5,bbox_to_anchor=(0.5,1.1))
最終的な視覚化効果は次のとおりです。

総括する ##
この号では、Python-seabornの古典的な視覚化作品の定期的なツイートを開始しました。最終結果にはまだ問題がありますが(もちろん、特定の場所をカスタマイズして解決できます)、主な目的は、特にそれに関しては、誰もが描画スキルを習得できるようにすることです。フィッティングカーブの描画(ホイールがある場合は、直接使用し、自分で再作成することは考えないでください)。