Concurrent requests in Python (part 2)
In [Python Concurrent Requests (Part 1)] (http://mp.weixin.qq.com/s?__biz=MzAwMzY3MTU3Nw==&mid=2650527260&idx=1&sn=b2cbbbb3d155b5b57beda28e2a35d0c1&chksm=8338e56ab44f6c7c8039d01af85e5f5f87998b1cd7671d9fe090dbf2bf6a1e8850f7630ec5c9&scene=21#wechat_redirect), a performance test tool that uses multithreading to write a high concurrent request for testing server programs is introduced in detail. In this test tool, after high concurrent requests, we get a very comprehensive response time, throughput, error rate, and other related information.
In the performance test, more are CPU-intensive and IO-intensive. Basically, many server-side programs are based on IO-intensive, so it will be more efficient to use multithreading in this way. We modified the previous code. Now that we can easily get the result information data of our performance test, do we provide it as an API based on the framework combined with Flask-Restful, so that others can directly call our API You can test the program of the server under test, which is more efficient and simple. Of course, this is just an idea. In the server-side test, we need to consider more whether the service will appear OOM, SockedTimeOut, TimeOut and other program information, such as MQ, under the premise of high concurrency and continuous requests. Message backlog, service breakdown and other abnormal situations. This article will not discuss the monitoring of services in detail here. For the monitoring of services under saasization, please refer to my article [Monitoring of services in saasized architecture] (http://mp.weixin.qq.com/s?__biz=MzAwMzY3MTU3Nw==&mid=2650526960&idx=1&sn=63a1717e5655e08d5b74e5bd77d36da1&chksm=8338e786b44f6e9084c30a7554f16071a2a4630f7181927b5a2696233b011be3267d718412e7&scene=21#wechat_redirect) implementation ideas and specific codes.
Next, we will encapsulate the specific API to be tested. Here is the case of testing the Taobao homepage. Our purpose is that we are in the PostMan testing tool. I only need to enter the number of concurrency and the address to be tested (here is Taobao), After clicking Send Request, you can get other performance test data such as response time. The specific source code is as follows:
#! /usr/bin/env python
#! coding:utf-8from flask import  Flask,make_response,jsonify,abort,request
from flask_restful import  Api,Resource
from flask import Flask

import  requests
import time
import  matplotlib.pyplot as plt
from threading import  Thread
import  datetime
import  numpy as np
import  json
import re
import hashlib
from urllib import parse
import datetime

app=Flask(__name__)
api=Api(app=app)

def getHeaders(url=None,caller='ucenter-interface-service',secret='6A3012039B5746CEA350B119535C45E0'):'''
 : param pathurl:Request address
 : param caller:Request header field caller
 : param secret:Request header field secret
 : return:After the request address is split, and then spliced for md5 encryption, it belongs to the request header
   '''
 result1 = re.compile(r'\/([^\/]*)\/(v\d+|\d\.\d)\/(.+)')
 result2 = result1.search(url)
 contextPath = result2[1]
 version = result2[2]
 requestPath = result2[3]if requestPath.endswith('/'):
  requestPath = requestPath[:-1]

 tempArray = requestPath.split("/")
 requestPath =""
 i =0for str in tempArray:
  # print(i)if tempArray[i]!="":
   # print(parse.quote(tempArray[i]))
   # print(tempArray[i])
   requestPath = requestPath +"/"+ parse.quote(tempArray[i])
  i = i +1
 nowTime = datetime.datetime.now().strftime('%Y-%m-%d %H:%M:%S')
 singStr= secret +"callerService"+ caller +"contextPath"+ contextPath +"requestPath"+ requestPath +"timestamp"+ nowTime +"v"+ version + secret
 sign=hashlib.md5(singStr.encode(encoding='utf-8')).hexdigest().upper()
 dict1={'X-Caller-Service':'ucenter-interface-service','X-Caller-Timestamp':nowTime,'appSecret':'kOsqkHX2QcB7KVzY03NmqbafIjSnCneG','Content-Type':'application/json','X-Caller-Sign':sign,}return dict1

classOlapThread(Thread):
 def __init__(self,func,args=()):'''
  : param func:Function being tested
  : param args:The return value of the function being tested
      '''
  super(OlapThread,self).__init__()
  self.func=func
  self.args=args

 def run(self)-> None:
  self.result=self.func(*self.args)

 def getResult(self):try:return self.result
  except BaseException as e:return e.args[0]

def taoBao(code,seconds,text,requestUrl):'''
 High concurrency pro seek Taobao
 : param code::param seconds::param text::param requestUrl:Request address
 : return:'''
 r=requests.get(url=requestUrl)print('Output information yesterday status code:{0},Response result:{1}'.format(r.status_code,r.text))
 code=r.status_code
 seconds=r.elapsed.total_seconds()
 text=r.text
 return code,seconds,text

def calculationTime(startTime,endTime):'''Calculate the difference between two times, the unit is seconds'''return(endTime-startTime).seconds

def getResult(seconds):'''Get the response time information of the server'''
 data={'Max':sorted(seconds)[-1],'Min':sorted(seconds)[0],'Median':np.median(seconds),'99%Line':np.percentile(seconds,99),'95%Line':np.percentile(seconds,95),'90%Line':np.percentile(seconds,90)}return data

def show(i,j):'''
 : param i:Total number of requests
 : param j:Request response time list
 : return:'''
 fig,ax=plt.subplots()
 ax.plot(list_count,seconds)
 ax.set(xlabel='number of times', ylabel='Request time-consuming',
   title='olap continuous request response time (seconds)')
 ax.grid()
 fig.savefig('olap.png')
 plt.show()

def highConcurrent(count,requestUrl):'''
 Send high concurrent requests to the server
 : param count:Concurrency
 : param requestData:Request parameter
 : param requestUrl:Request address
 : return:'''
 startTime=datetime.datetime.now()
 sum=0
 list_count=list()
 tasks=list()
 results =list()
 # Failed message
 fails=[]
 # Number of successful tasks
 success=[]
 codes =list()
 seconds =list()
 texts=[]for i inrange(0,count):
  t=OlapThread(taoBao,args=(i,i,i,requestUrl))
  tasks.append(t)
  t.start()print('testing:{0}'.format(i))for t in tasks:
  t.join()if t.getResult()[0]!=200:
   fails.append(t.getResult())
  results.append(t.getResult())for item in fails:print('Request failed information:\n',item[2])
 endTime=datetime.datetime.now()for item in results:
  codes.append(item[0])
  seconds.append(item[1])
  texts.append(item[2])for i inrange(len(codes)):
  list_count.append(i)

 # Generate a visual trend chart
 fig,ax=plt.subplots()
 ax.plot(list_count,seconds)
 ax.set(xlabel='number of times', ylabel='Request time-consuming',
   title='taobao continuous request response time (seconds)')
 ax.grid()
 fig.savefig('taobao.png')
 plt.show()for i in seconds:
  sum+=i
 rate=sum/len(list_count)
 # print('\n total duration:\n',endTime-startTime)
 totalTime=calculationTime(startTime=startTime,endTime=endTime)if totalTime<1:
  totalTime=1
 # Throughput calculation
 try:
  throughput=int(len(list_count)/totalTime)
 except Exception as e:print(e.args[0])getResult(seconds=seconds)
 errorRate=0iflen(fails)==0:
  errorRate=0.00else:
  errorRate=len(fails)/len(tasks)*100
 throughput=str(throughput)+'/S'
 timeData=getResult(seconds=seconds)
 # print('Total time:',(endTime-startTime))
 timeConsuming=(endTime-startTime)return timeConsuming,throughput,rate,timeData,errorRate,len(list_count),len(fails)classIndex(Resource):
 def get(self):return{'status':0,'msg':'ok','datas':[]}

 def post(self):if not request.json:returnjsonify({'status':1001,'msg':'The request parameter is not JSON data, please check, thank you!'})else:try:
   data={'count':request.json.get('count'),'requestUrl':request.json.get('requestUrl')}
   timeConsuming,throughput,rate,timeData,errorRate,sum,fails=highConcurrent(
    count=data['count'],
    requestUrl=data['requestUrl'])print('Total execution time:',timeConsuming)returnjsonify({'status':0,'msg':'Request succeeded','datas':[{'Throughput':throughput,'Average response time':rate,'Response time information':timeData,'Error rate':errorRate,'Total number of requests':sum,'Number of failures':fails
            }]},200)
   except Exception as e:return e.args[0]

api.add_resource(Index,'/v1/index')if __name__ =='__main__':
 app.run(debug=True,port=5003,host='0.0.0.0')
# print(highConcurrent(count=5))
Call in PostMan, as shown in the following figure:

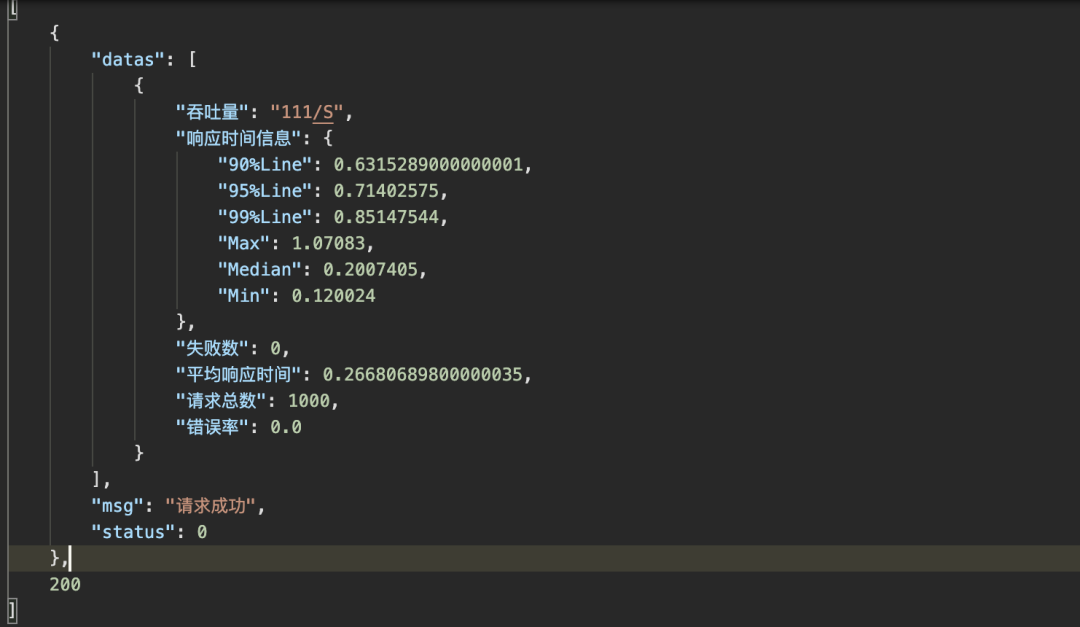
After clicking Sending, the result information displayed in PostMan is as follows:

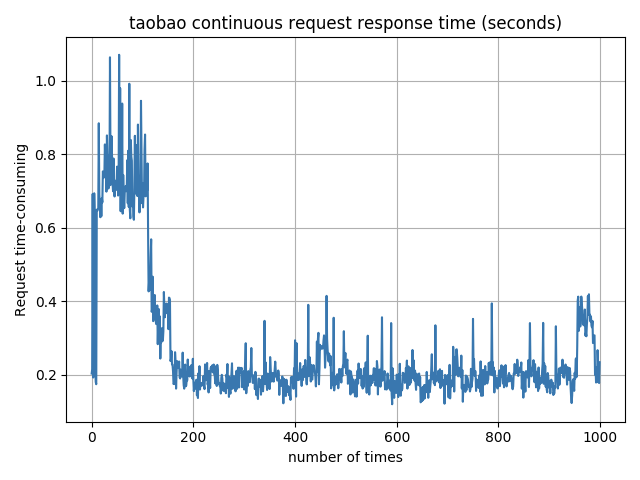
The visualized trend chart of response time for each request is as follows:

Recommended Posts