Build a highly available Replication cluster to archive large amounts of cold data
Hot and cold data separation##
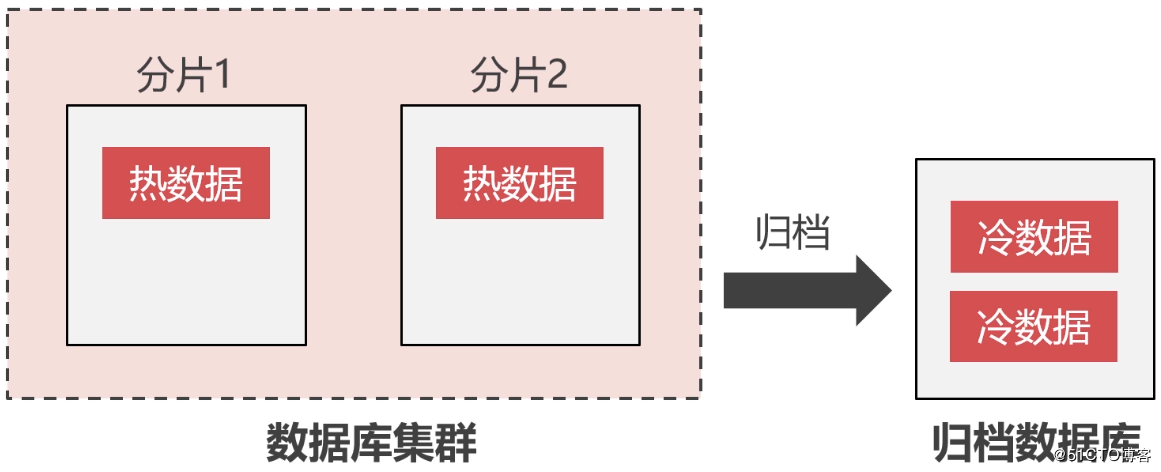
Business continues to grow, and the data in cluster shards will increase over time. A considerable part of the data is rarely used, such as order records, transaction records, product reviews and other data from a few years ago . This part of the data is called cold data, while the data that is frequently used is called hot data.
We all know that when the single table data volume of MySQL exceeds 20 million, the read and write performance will drop sharply. If most of the stored data is high-value hot data, it's good to say that you can spend money to expand the cluster shards, because these data can bring benefits. But if it is low-value cold data, there is no need to spend this money.
Therefore, we need to separate the cold data from the cluster shards and store it in a dedicated archive database to free up storage space and reduce the storage pressure of the cluster shards. Let the cluster shards store only hot data as much as possible to maintain a better read and write performance without wasting storage space on cold data:
It is not suitable to use the InnoDB engine on the archive database, because the instantaneous write performance of InnoDB is not high. TokuDB produced by Percona is usually used as the storage engine of the archive database. Because the engine has the following characteristics:
- High compression ratio, high write performance
- You can create indexes and fields online
- Support transaction features
- Support master-slave synchronization
Setting up a Replication cluster##
The previous section introduced the concept of separation of hot and cold data. In this section, we will build a highly available Replication cluster for archiving cold data. Although it is an archive library, it must also be highly available. After all, a single point of failure in the database is not allowed in the actual enterprise. Moreover, the data in the archive library will not be used, but the probability of use is not high.
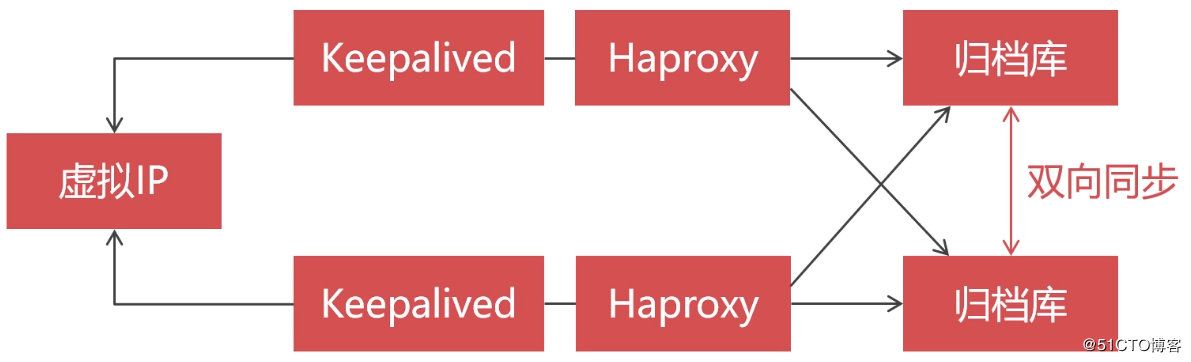
The Replication cluster architecture design in this article is as follows:
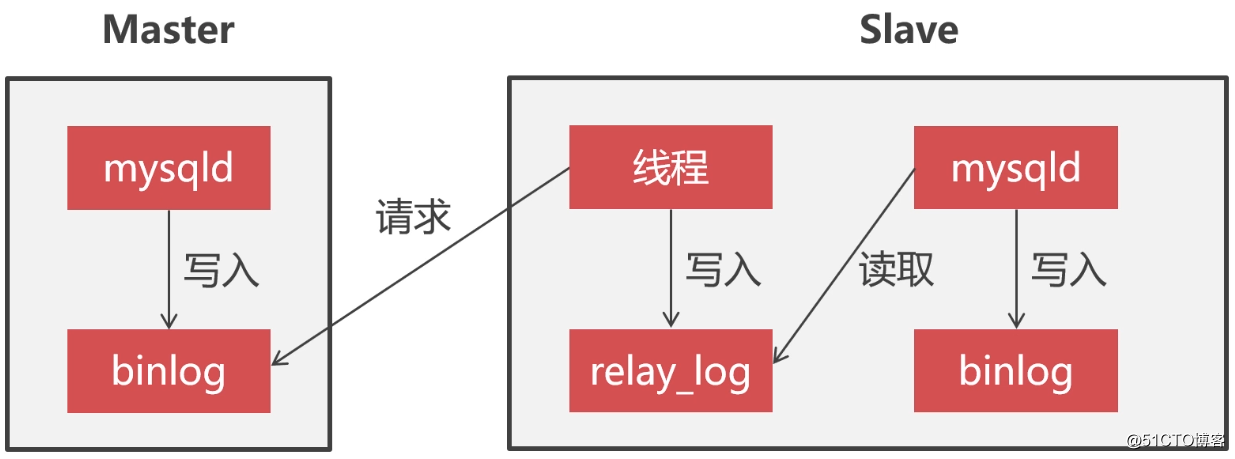
The so-called Replication cluster is the master-slave architecture we often say. In a Replication cluster, nodes are divided into two roles: Master and Slave. Master mainly provides write services, while Slave provides read services, and usually Slave is set to read_only.
The data synchronization between the master and slave nodes is asynchronous. Slave uses a thread to monitor the binlog log of the Master node. When the binlog log of the Master changes, the thread will read the content of the binlog log of the Master And write it to the local relay_log. Then the mysql process will periodically read the relay_log and write the data to the local binlog file, thus achieving data synchronization between the master and the slave. As shown below:
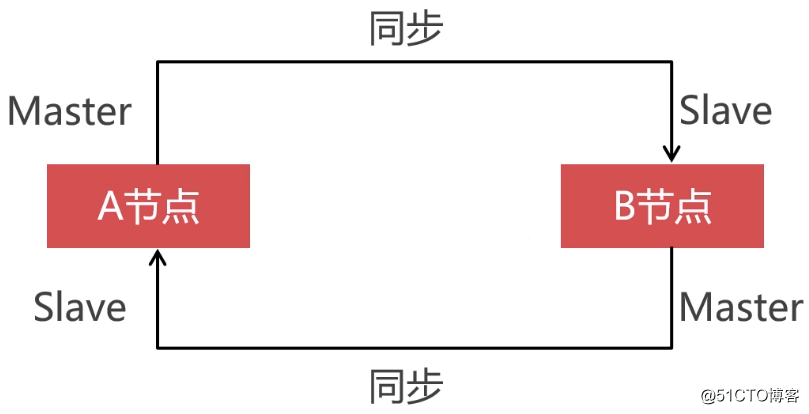
In order to ensure the high availability of the Replication cluster, we need to make the two database nodes have a master-slave relationship with each other to achieve two-way data synchronization. In this way, the master-slave switch can be performed when the master node is down, otherwise the master node will not synchronize data with the slave node after recovery, which will cause data inconsistency between nodes:
Ready to work###
Next, start to prepare the pre-environment for cluster construction. First, you need to create 4 virtual machines, two of which are installed with Percona Server for Replication clusters, and two are installed with Haproxy and Keepalived for [Load Balancing] (https://cloud.tencent.com/product/clb?from=10680) and dual machine hot backup:
| Role | Host | IP |
|---|---|---|
| Haproxy+Keepalived | HA-01 | 192.168.190.135 |
| Haproxy+Keepalived | HA-02 | 192.168.190.143 |
| Percona Server | node-A | 192.168.190.142 |
| Percona Server | node-B | 192.168.190.131 |
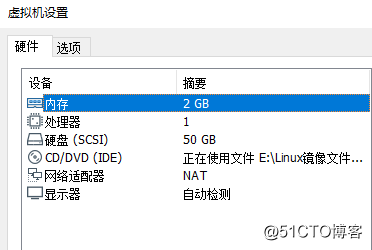
The configuration of each virtual machine is as follows:
Environmental version description:
- Operating system: CentOS 8
- Percona Server:8.0.18
- TokuDB:8.0.18
- Haproxy:1.8.15-5.el8
- Keepalived:2.0.10-4.el8_0.2
Install TokuDB
I mentioned that InnoDB should be used as a storage engine for archive databases because of its characteristics. TokuDB can be installed on any derivative version of MySQL. This article uses Percona Server as a demonstration.
I have already installed Percona Server on the two virtual machines 192.168.190.142 and 192.168.190.131 here. If you don’t know how to install it, please refer to: Install Percona Server Database (in CentOS 8). Next, we start to install TokuDB for Percona Server.
First of all, before installing TokuDB, make sure that the jemalloc library is already in the system. If not, you can install it with the following command:
[ root@node-A ~]# yum install -y jemalloc
[ root@node-A ~]# ls /usr/lib64/|grep jemalloc  #The path of the library file
libjemalloc.so.1[root@node-A ~]#
Add the configuration of the path where the jemalloc library file is located in the configuration file:
[ root@node-A ~]# vim /etc/my.cnf
...[ mysql_safe]
malloc-lib=/usr/lib64/libjemalloc.so.1
After completing the modification of the configuration file, restart the database service:
[ root@node-A ~]# systemctl restart mysqld
In order to ensure the write performance of TokuDB, we need to adjust the large page memory management settings of the Linux system. The command is as follows:
# Use dynamically allocated memory instead of pre-allocated memory
[ root@node-A ~]# echo never >/sys/kernel/mm/transparent_hugepage/enabled
# Turn on memory defragmentation
[ root@node-A ~]# echo never >/sys/kernel/mm/transparent_hugepage/defrag
Install the TokuDB engine through the official yum repository:
[ root@node-A ~]# yum install -y https://repo.percona.com/yum/percona-release-latest.noarch.rpm
[ root@node-A ~]# percona-release setup ps80
[ root@node-A ~]# yum install -y percona-server-tokudb.x86_64
Then use the ps-admin command to install the TokuDB engine on MySQL:
[ root@node-A ~]# ps-admin --enable-tokudb -uroot -p
Restart the database service:
[ root@node-A ~]# systemctl restart mysqld
After the database restart is complete, execute the ps-admin command again to activate the TokuDB engine:
[ root@node-A ~]# ps-admin --enable-tokudb -uroot -p
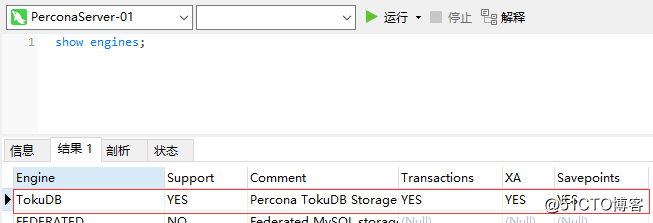
Finally, use the show engines; statement to verify whether the TokuDB engine has been successfully installed on MySQL:
Configure the master-slave relationship###
First, create database accounts for synchronization on the two nodes:
create user 'backup'@'%' identified by 'Abc_123456';
grant super, reload, replication slave on *.* to 'backup'@'%';
flush privileges;
- **Tips: **After creating the account, you need to use the account to log in to each other at the two nodes to ensure that the account is available
Then modify the MySQL configuration file:
[ root@node-A ~]# vim /etc/my.cnf
[ mysqld]
# Set the id of the node
server_id=101
# Open binlog
log_bin=mysql_bin
# Enable relay_log
relay_log=relay_bin
The other node also has the same configuration, but server_id cannot be the same:
[ root@node-B ~]# vim /etc/my.cnf
[ mysqld]
server_id=102
log_bin=mysql_bin
relay_log=relay_bin
After modifying the configuration file, restart the MySQL service:
[ root@node-A ~]# systemctl restart mysqld
[ root@node-B ~]# systemctl restart mysqld
Configure the master-slave relationship between node-B and node-A###
Enter the MySQL command line terminal of node-B and execute the following statements respectively:
mysql> stop slave;--Stop master-slave synchronization
mysql> change master to master_host='192.168.190.142', master_port=3306, master_user='backup', master_password='Abc_123456';--Configure the connection information of the Master node
mysql> start slave;--Start master-slave synchronization
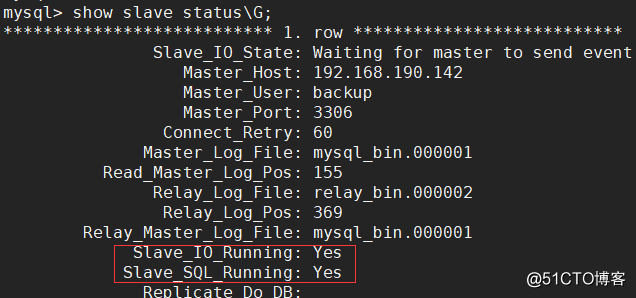
Use the show slave status\G; statement to view the master-slave synchronization status, the values of Slave_IO_Running and Slave_SQL_Running are both Yes to indicate that the master-slave synchronization status is normal:
Configure the master-slave relationship between node-A and node-B###
In order to achieve two-way synchronization, node-A and node-B need to have a master-slave relationship with each other, so the master-slave relationship between node-A and node-B needs to be configured. Enter the MySQL command line terminal of node-A and execute the following statements respectively. Note that the master_host here needs to be the ip of node-B:
mysql> stop slave;--Stop master-slave synchronization
mysql> change master to master_host='192.168.190.131', master_port=3306, master_user='backup', master_password='Abc_123456';--Configure the connection information of the Master node
mysql> start slave;--Start master-slave synchronization
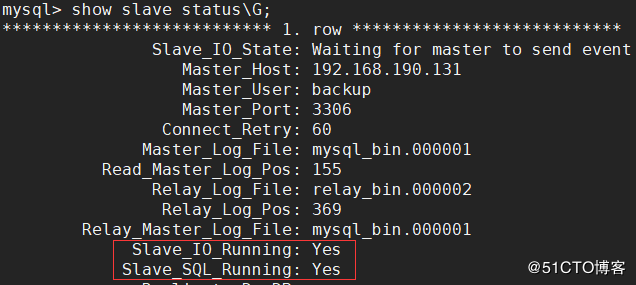
After the same configuration is completed, use the show slave status\G; statement to view the master-slave synchronization status. The values of Slave_IO_Running and Slave_SQL_Running are both Yes to indicate that the master-slave synchronization status is normal:
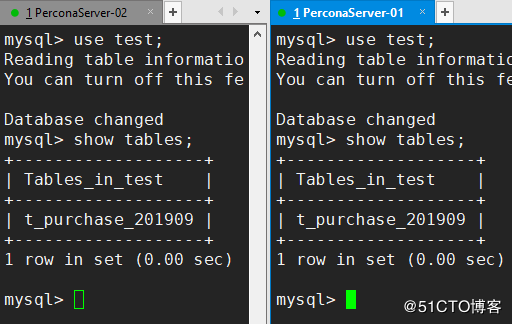
Test master-slave synchronization###
After configuring the master-slave synchronization relationship of the two nodes, we have completed the establishment of the Replication cluster. Next, we create an archive table on any node to see if the data can be normally synchronized between the two nodes. The specific table SQL is as follows:
create table t_purchase_201909(
 id int unsigned primary key,
 purchase_price decimal(10,2) not null comment 'Purchase price',
 purchase_num int unsigned not null comment 'Purchase quantity',
 purchase_sum decimal(10,2) not null comment 'Total purchase price',
 purchase_buyer int unsigned not null comment 'purchaser',
 purchase_date timestamp not nulldefault current_timestamp comment 'Purchase date',
 company_id int unsigned not null comment 'Id of the purchasing company',
 goods_id int unsigned not null comment 'Product id',
 key idx_company_id(company_id),
 key idx_goods_id(goods_id)) engine=TokuDB comment 'Inbound data filing table for September 2019';
I can synchronize normally here. Both nodes in the figure can see this table:
Install Haproxy
So far, we have completed the establishment and testing of the Replication cluster. The next step is to make the Replication cluster highly available, which is the turn of Haproxy. Haproxy is a proxy software that provides high availability, load balancing, and TCP (layer 4) and HTTP (layer 7) applications. Use Haproxy to load balance the MySQL cluster, give the cluster high availability and give full play to the performance of the cluster.
Since Haproxy is an old-brand load balancing component, the installation package of this component is included in the yum repository of CentOS, and the installation is very simple. The installation command is as follows:
[ root@HA-01~]# yum install -y haproxy
After the installation is complete, edit the configuration file of Haproxy, add the monitoring interface and the configuration of the database node that needs proxy:
[ root@HA-01~]# vim /etc/haproxy/haproxy.cfg
# Add the following configuration items at the end of the file
# Monitoring interface configuration
listen admin_stats
 # Bound ip and listening port
 bind 0.0.0.0:4001
 # Access agreement
 mode http
 # URI relative address
 stats uri /dbs
 # Statistical report format
 stats realm Global\ statistics
 # Account password used to log in to the monitoring interface
 stats auth admin:abc123456

# Database load balancing configuration
listen proxy-mysql
 # Bound ip and listening port
 bind 0.0.0.0:3306
 # Access agreement
 mode tcp
 # Load balancing algorithm
 # roundrobin: poll
 # static-rr: weight
 # leastconn: least connection
 # source: request source ip
 balance roundrobin
 # Log format
 option tcplog
 # Hosts that need to be load balanced
 server node-A 192.168.190.142:3306 check port 3306 weight 1 maxconn 2000
 server node-B 192.168.190.131:3306 check port 3306 weight 1 maxconn 2000
 # Use keepalive to detect dead links
 option tcpka
Because the 3306 port is configured for TCP forwarding and 4001 as the access port of the Haproxy monitoring interface, these two ports need to be opened on the firewall:
[ root@HA-01~]# firewall-cmd --zone=public--add-port=3306/tcp --permanent
[ root@HA-01~]# firewall-cmd --zone=public--add-port=4001/tcp --permanent
[ root@HA-01~]# firewall-cmd --reload
After completing the above steps, start the Haproxy service:
[ root@HA-01~]# systemctl start haproxy
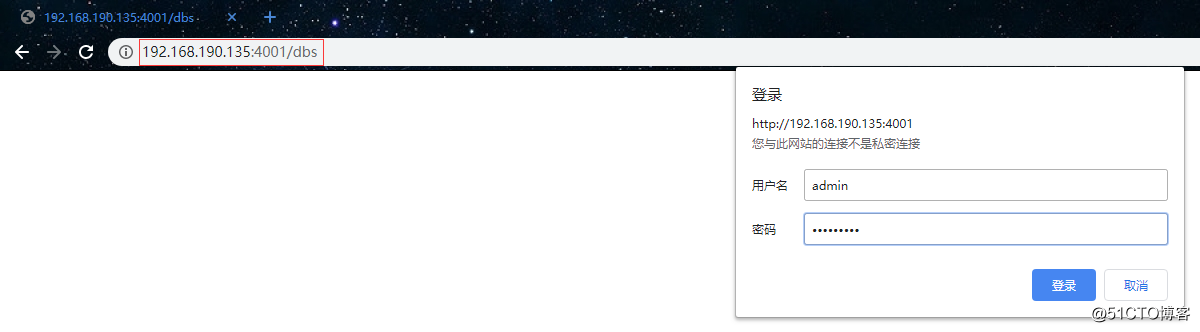
Then use the browser to access the Haproxy monitoring interface. The first time you visit, you will be asked to enter the username and password, where the username and password are configured in the configuration file:
After successful login, you will see the following page:
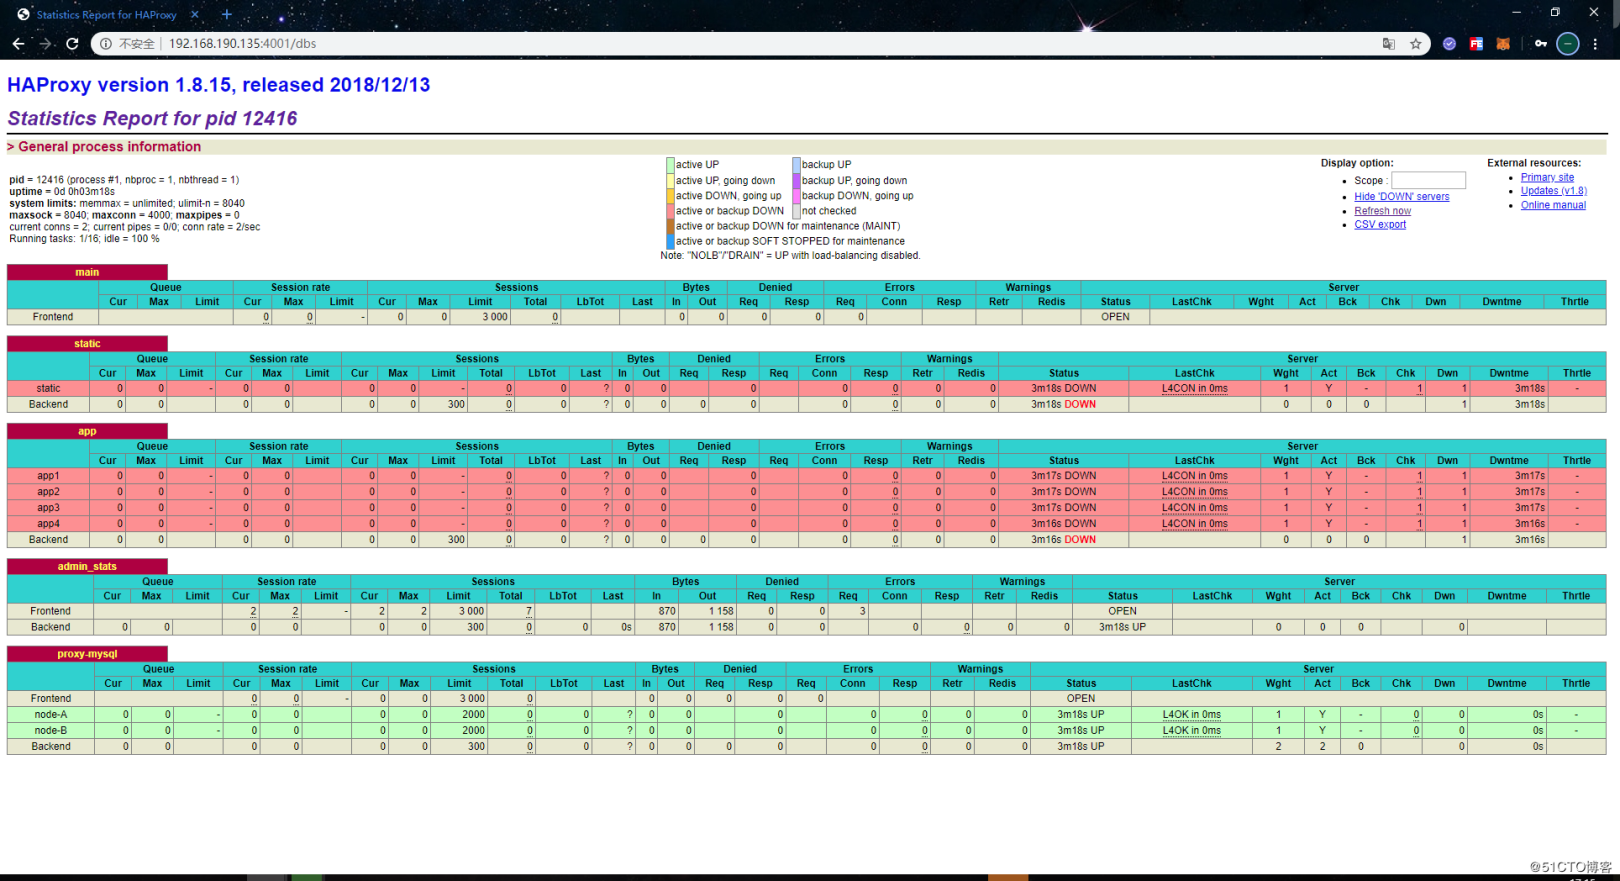
The monitoring information provided by Haproxy's monitoring interface is also relatively comprehensive. Under this interface, we can see the connection information of each host and its own status. When the host cannot be connected, the column of Status will display DOWN, and the background color will also change to red. The value in the normal state is UP, and the background color is green.
Another Haproxy node also uses the above steps to install and configure, so I won’t repeat it here.
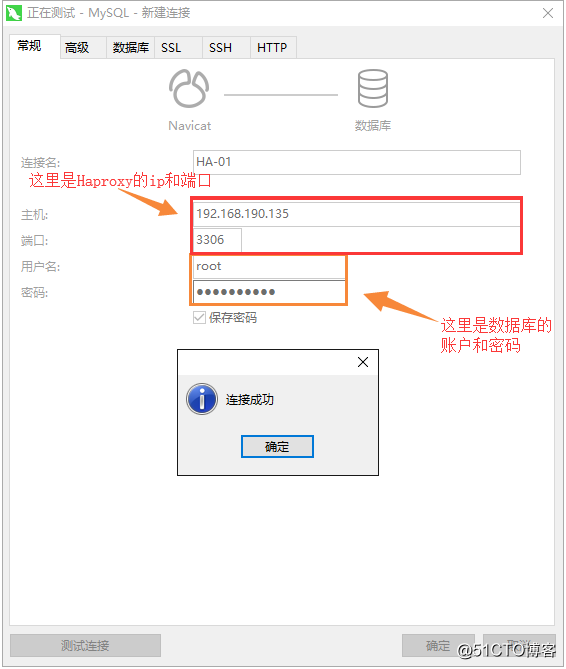
Test Haproxy
After the Haproxy service is set up, let's use the remote tool to test whether we can connect to the database normally through Haproxy. as follows:
After the connection is successful, execute some SQL statements on Haproxy to see if you can insert data and query data normally:
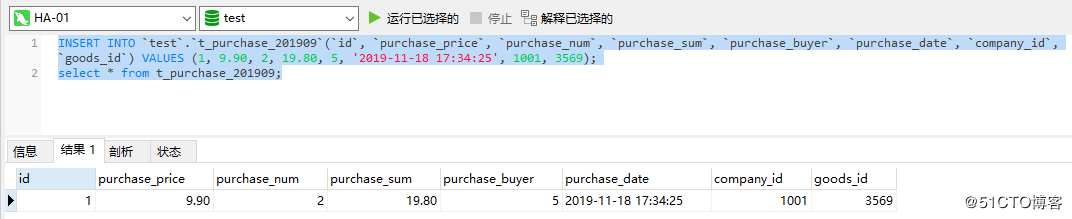
We built Haproxy to make the Replication cluster highly available, so finally test whether the Replication cluster has high availability, first stop one of the nodes:
[ root@node-B ~]# systemctl stop mysqld
At this point, from the monitoring interface of Haproxy, you can see that the node node-B is already offline:

Now there is one node left in the cluster, and then we execute some SQL statements on Haproxy to see if we can insert data and query data normally:
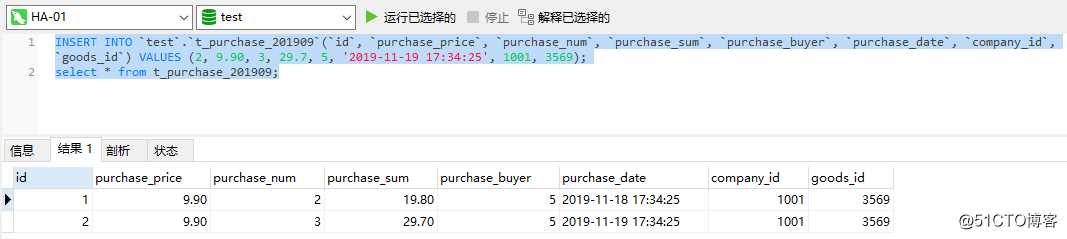
As can be seen from the test results, insert and query statements can still be executed normally. In other words, even if one node is turned off at this time, the entire database cluster can still be used normally, indicating that the Replication cluster is now highly available.
Use Keepalived to achieve high availability of Haproxy###
After achieving the high availability of the Replication cluster, we have to achieve the high availability of Haproxy, because Haproxy, as an entrance responsible for receiving client requests and forwarding the requests to the back-end database cluster, inevitably requires high availability. Otherwise, if Haproxy has a single point of failure, it will not be able to access all database cluster nodes proxied by Haproxy, which will have a huge impact on the entire system.
Only one available Haproxy needs to exist at the same time, otherwise the client will not know which Haproxy to connect to. This is also the reason why Keepalived's virtual IP is used. This mechanism allows multiple nodes to still use the same IP when they take over from each other, and the client only needs to connect to this virtual IP from beginning to end. Therefore, to achieve the high availability of Haproxy, it is Keepalived's turn to come out. Before installing Keepalived, you need to enable the VRRP protocol of the firewall:
[ root@HA-01~]# firewall-cmd --direct --permanent --add-rule ipv4 filter INPUT 0--protocol vrrp -j ACCEPT
[ root@HA-01~]# firewall-cmd --reload
Then you can use the yum command to install Keepalived:
[ root@HA-01~]# yum install -y keepalived
After the installation is complete, edit the keepalived configuration file:
[ root@HA-01~]# mv /etc/keepalived/keepalived.conf /etc/keepalived/keepalived.conf.bak  #Do not use the built-in configuration file
[ root@HA-01~]# vim /etc/keepalived/keepalived.conf
vrrp_instance VI_1 {
 state MASTER
 interfaceens32
 virtual_router_id 51
 priority 100
 advert_int 1
 authentication {
  auth_type PASS
  auth_pass 123456}

 virtual_ipaddress {192.168.190.101}}
Configuration instructions:
-
state MASTER: Define the role of the node as master. When the role is master, the node can obtain VIP without vying for it. Multiple masters are allowed in the cluster. When there are multiple masters, the masters need to compete for VIP. For other roles, the VIP can only be obtained when the master is offline -
interface ens32: define the name of the network card that can be used for external communication, the name of the network card can be viewed through theip addrcommand -
virtual_router_id 51: Define the id of the virtual route, the value is 0-255, the value of each node needs to be unique, that is, it cannot be configured to be the same -
priority 100: define the weight, the higher the weight, the more priority to get VIP -
advert_int 1: Define the detection interval as 1 second -
authentication: define the authentication information used in the heartbeat check -
auth_type PASS: Define the authentication type as password -
auth_pass 123456: define a specific password -
virtual_ipaddress: Define virtual IP (VIP), which needs to be an IP under the same network segment, and each node needs to be consistent
After completing the above configuration, start the keepalived service:
[ root@HA-01~]# systemctl start keepalived
When the keepalived service starts successfully, use the ip addr command to view the virtual IP bound to the network card:
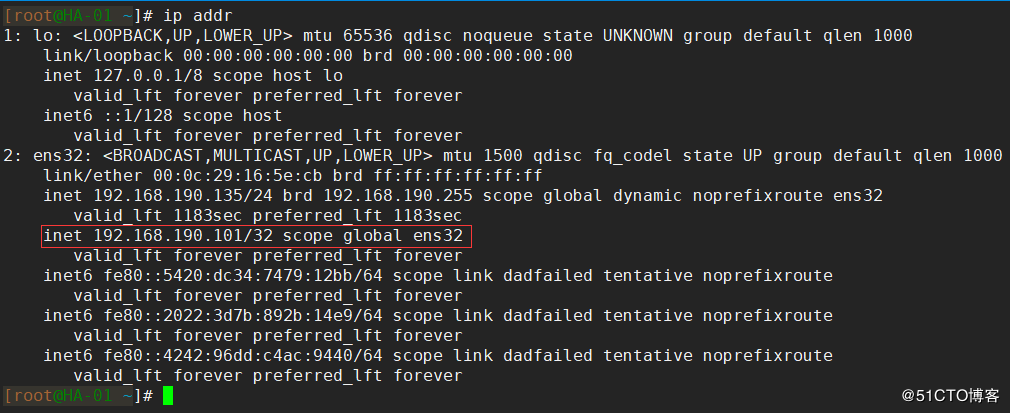
The other node is also installed and configured using the above steps, so I won't repeat it here. But note that virtual_router_id cannot be configured to be the same, and virtual_ipaddress must be configured to be the same virtual ip.
Test Keepalived
Above we have completed the installation and configuration of Keepalived. Finally, we will test whether the Keepalived service is available and whether Haproxy has high availability.
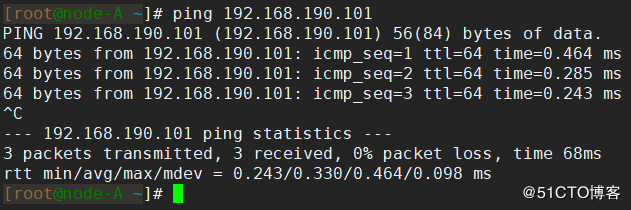
First, test whether the virtual IP can be pinged normally on other nodes. If it cannot be pinged, you need to check the configuration. As shown in the figure, I can normally ping here:
Common virtual IP ping failure:
- The firewall configuration is incorrect, and the VRRP protocol is not opened correctly
- The configured virtual IP is not in the same network segment as the IP of other nodes
- Keepalived is configured incorrectly, or Keepalived did not start successfully at all
After confirming that the Keepalived virtual IP can be pinged from the outside, use Navicat to test whether the virtual IP can be connected to the database:
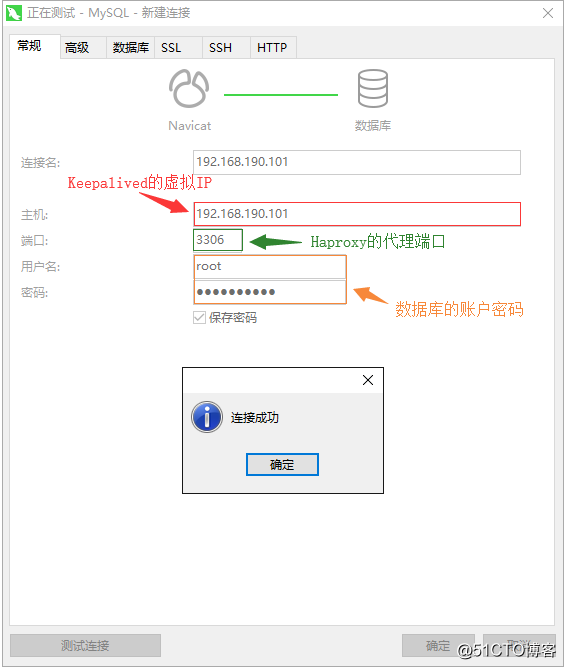
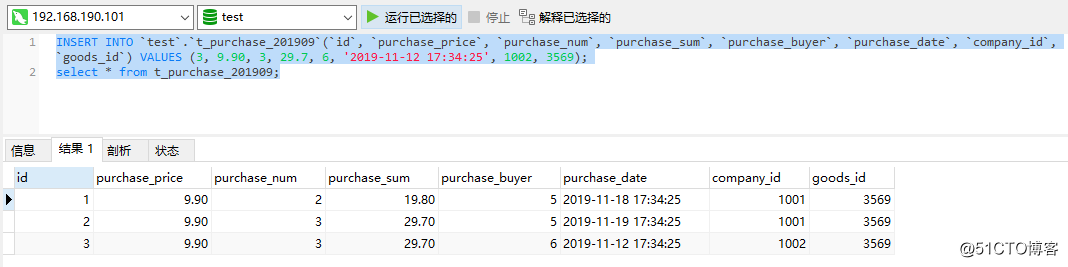
After the connection is successful, execute some statements to test whether the data can be inserted and queried normally:
At this point, there is basically no problem. Finally, test the high availability of Haproxy and turn off the Keepalived and Haproxy services on one of the Haproxy nodes:
[ root@HA-01~]# systemctl stop keepalived
[ root@HA-01~]# systemctl stop haproxy
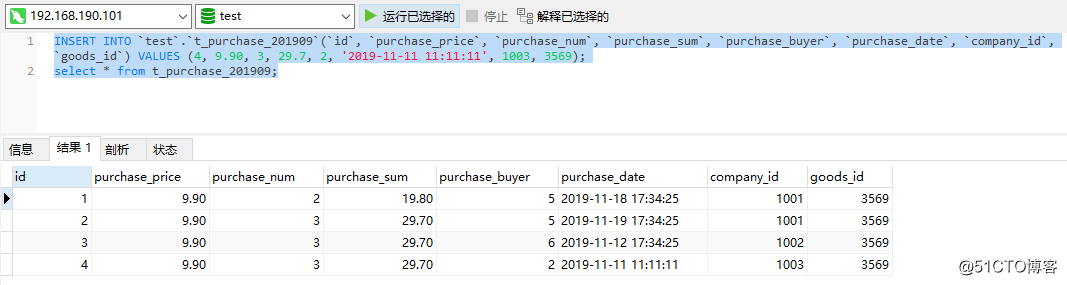
Then execute some statements again to test whether the data can be inserted and query normally. The following can be executed normally, which means that the Haproxy node has high availability:
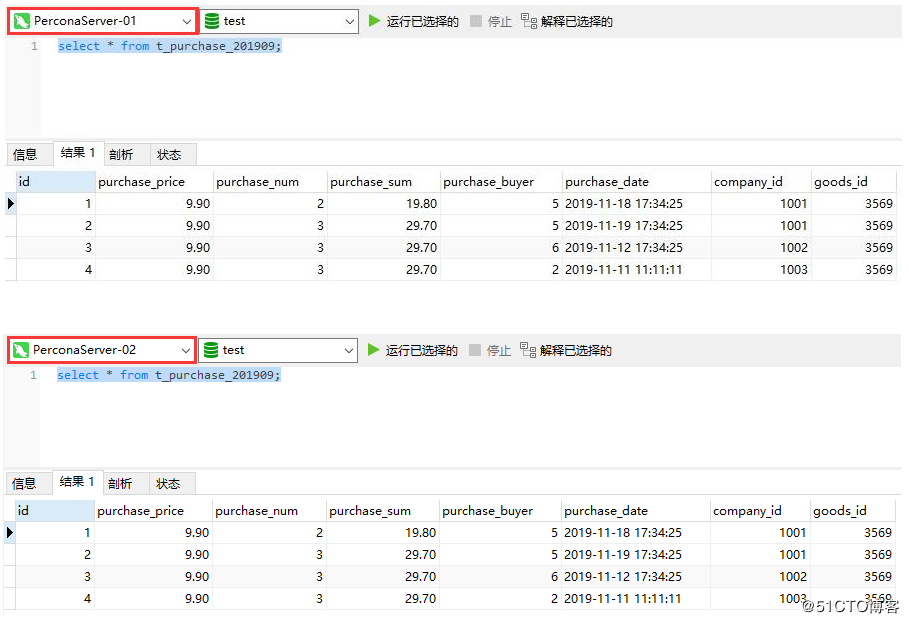
Finally, restore all services to the running state, and verify whether the data is consistent after the stopped node is restored. As follows, the data of the two Replication nodes here are the same:
Practice data archive##
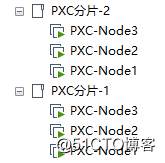
So far, we have completed the establishment of a highly available Replication cluster. The next step is to practice how to strip a large amount of cold data from the PXC cluster shards and archive them into the Replication cluster. I have two PXC cluster shards here:
- For the content of PXC cluster, please refer to another article: Introduce Mycat for PXC cluster and build a complete high-availability cluster architecture
There is a t_purchase table in each shard, and its table SQL is as follows.
create table t_purchase(
 id int unsigned primary key,
 purchase_price decimal(10,2) not null comment 'Purchase price',
 purchase_num int unsigned not null comment 'Purchase quantity',
 purchase_sum decimal(10,2) not null comment 'Total purchase price',
 purchase_buyer int unsigned not null comment 'purchaser',
 purchase_date timestamp not nulldefault current_timestamp comment 'Purchase date',
 company_id int unsigned not null comment 'Id of the purchasing company',
 goods_id int unsigned not null comment 'Product id',
 key idx_company_id(company_id),
 key idx_goods_id(goods_id)) comment 'Purchase list';
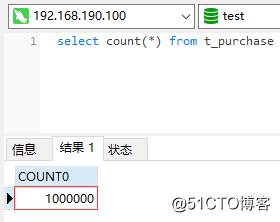
Each shard stores a total of 100w purchase data:
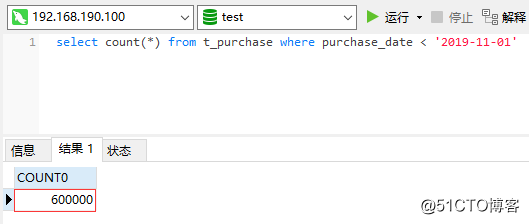
Among them, 60w items of purchase data have purchase dates before 2019-11-01:
The current demand is to strip out all the data before 2019-11-01 for archiving. How can this be achieved? It is definitely troublesome to write the code by yourself. Fortunately, the Percona toolkit provides a tool for archiving data: pt-archiver, using this tool can easily complete data archiving, eliminating the trouble of writing your own archiving program . pt-archiver has two main purposes:
- Export online data to offline for data processing
- Clean up expired data and archive the data to the local archive table or remote archive server
To use pt-archiver, you must first install the Percona toolkit:
[ root@node-A ~]# yum install -y https://repo.percona.com/yum/percona-release-latest.noarch.rpm
[ root@node-A ~]# percona-release enable ps-80 release
[ root@node-A ~]# yum install -y percona-toolkit
After the installation is complete, verify that the pt-archiver command is available:
[ root@node-A ~]# pt-archiver --version
pt-archiver 3.1.0[root@node-A ~]#
Then you can use the pt-archiver command to archive data. First, you need to create an archive table in the Replication cluster. The table name is suffixed with the date of the archived data, and the storage engine uses TokuDB. The specific table SQL is as follows:
create table t_purchase_201910(
 id int unsigned primary key,
 purchase_price decimal(10,2) not null comment 'Purchase price',
 purchase_num int unsigned not null comment 'Purchase quantity',
 purchase_sum decimal(10,2) not null comment 'Total purchase price',
 purchase_buyer int unsigned not null comment 'purchaser',
 purchase_date timestamp not nulldefault current_timestamp comment 'Purchase date',
 company_id int unsigned not null comment 'Id of the purchasing company',
 goods_id int unsigned not null comment 'Product id',
 key idx_company_id(company_id),
 key idx_goods_id(goods_id)) engine=TokuDB comment 'Filing table of purchase data for October 2019';
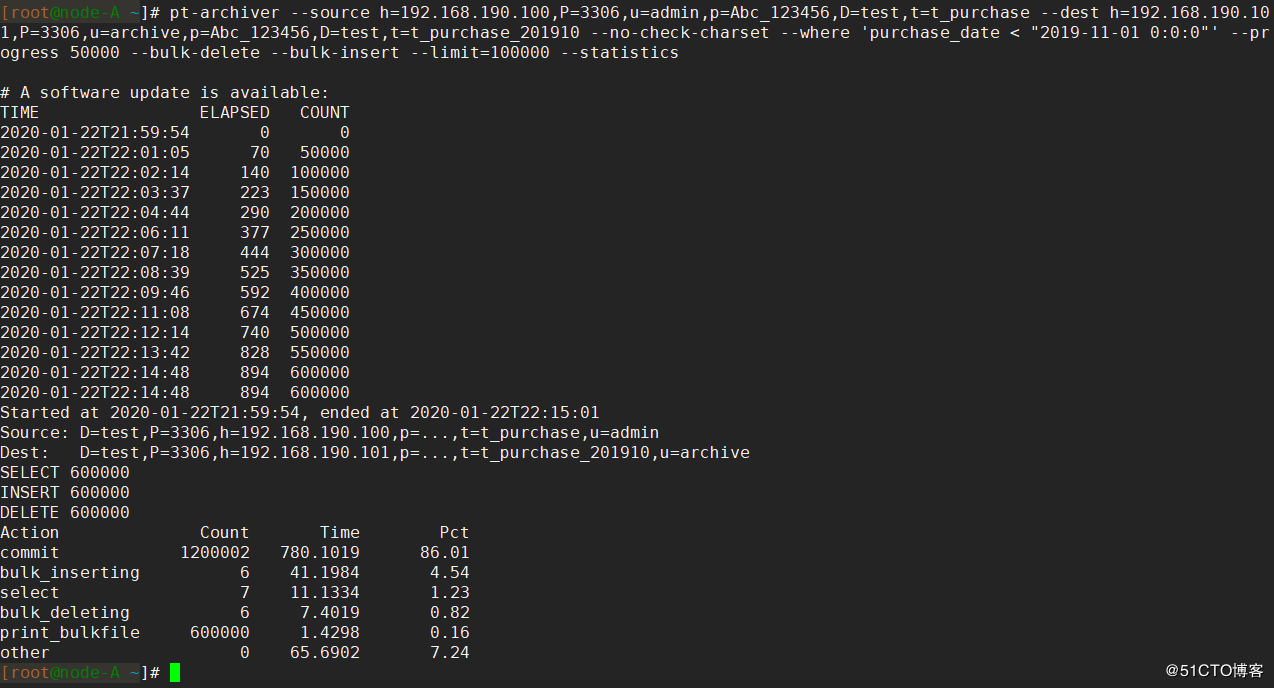
Then use the pt-archiver command to complete the data archive, as shown in the following example:
[ root@node-A ~]# pt-archiver --source h=192.168.190.100,P=3306,u=admin,p=Abc_123456,D=test,t=t_purchase --dest h=192.168.190.101,P=3306,u=archive,p=Abc_123456,D=test,t=t_purchase_201910 --no-check-charset --where 'purchase_date < "2019-11-01 0:0:0"'--progress 50000--bulk-delete--bulk-insert --limit=100000--statistics
- **Tips: The **
pt-archivercommand uses theload datastatement to import data, so make sure that MySQL haslocal_infileenabled. Archive data will fail if it is not enabled, you can useset global local_infile ='ON';statement to enablelocal_infile.
Command parameter description:
- - source: specify which database to read data from- - dest: Specify which database to archive data to- - no-check-charset: Do not check the character set of the data- - where: Specify which data to archive, in this case it is to archive the data before2019-09-11- - progress: Specify the status information to be printed once when how many pieces of data are archived- - bulk-delete: Specify batch deletion of archived data. The deletion of data is guaranteed by transaction, and there will be no case of deleting data without successful archiving- - bulk-insert: specify batch write archive data- - limit: Specify how many pieces of data to archive each time- - statistics: Print statistics after archiving data
Wait for about 15 minutes to complete the data archiving. The output statistics are as follows:
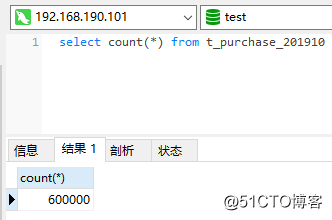
At this point, you can see that the 60w data has been stored in the archive table on the Replication cluster:
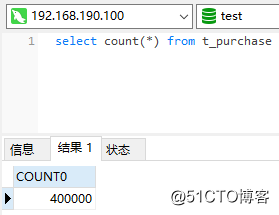
And there is only 40w data left in the original PXC cluster:
In this way, we have completed the separation of cold and hot data, and stored a large amount of cold data in the designated archive database.
to sum up##
- Separate cold and hot data, store low-value cold data in the archive library, maintain the read and write efficiency of hot data
- Use TokuDB engine to save archived data, with high-speed writing characteristics
- Use the dual-system hot backup solution to build an archive library with high availability
- Use
pt-archiverto export large amounts of data and archive storage, and it is simple and easy