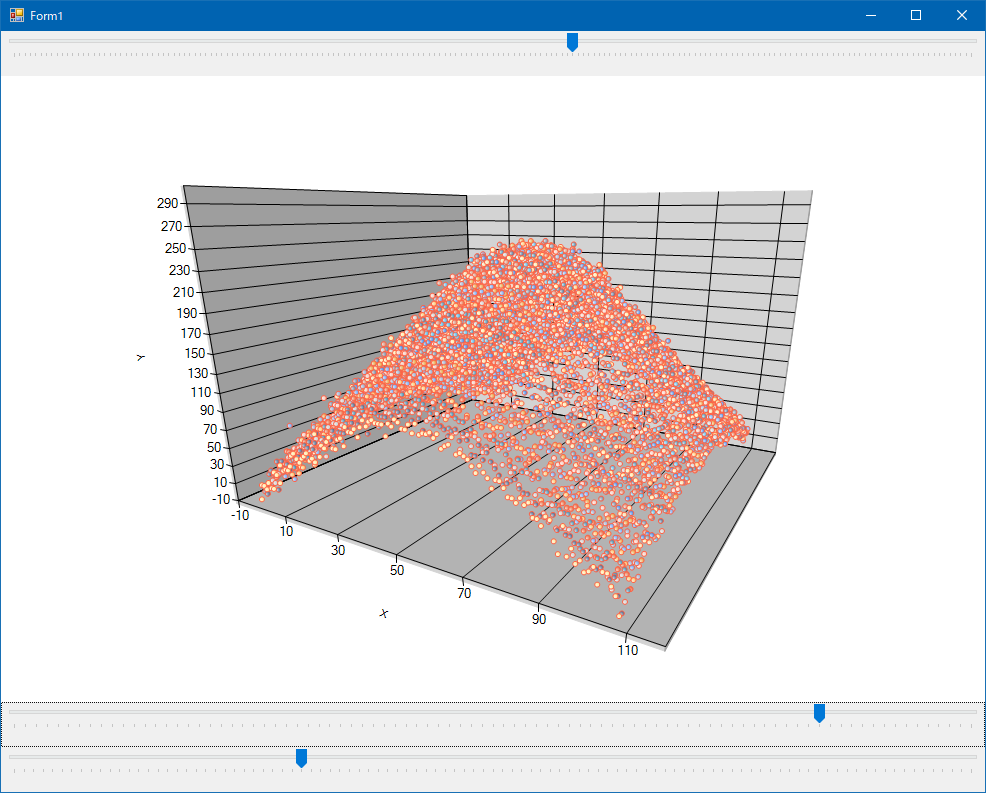
[WinForms] 3D chart
1 minute read
using System;
using System.Drawing;
using System.Windows.Forms;
using System.Windows.Forms.DataVisualization.Charting;

using OpenCvSharp;

namespace ChartingApp
{
    public partial class Form1 : Form
    {
        Chart chart;
        public Form1()
        {
            InitializeComponent();

            var image = new Mat("data.bmp", ImreadModes.Grayscale);
            image = image.Resize(new OpenCvSharp.Size(image.Cols / 30, image.Rows / 30));
            image = image.Normalize(0, 255, NormTypes.MinMax);

            this.Width = 1000;
            this.Height = 800;

            TrackBar track = new TrackBar();
            track.Dock = DockStyle.Bottom;
            track.Minimum = -44;
            track.Maximum = 44;
            track.LargeChange = 50;
            track.SmallChange = 50;
            track.Value = 30;
            this.Controls.Add(track);

            TrackBar track2 = new TrackBar();
            track2.Dock = DockStyle.Top;
            track2.Minimum = -90;
            track2.Maximum = 90;
            track2.LargeChange = 1;
            track2.SmallChange = 1;
            track2.Value = 15;
            this.Controls.Add(track2);

            TrackBar track3 = new TrackBar();
            track3.Dock = DockStyle.Bottom;
            track3.Minimum = 0;
            track3.Maximum = 100;
            track3.LargeChange = 1;
            track3.SmallChange = 1;
            track3.Value = 30;
            this.Controls.Add(track3);

            ChartArea area = new ChartArea();

            area.AxisX.Title = "X";
            area.AxisX.Minimum = -10;
            area.AxisX.Maximum = image.Cols + 10;
            area.AxisX.Interval = 20;

            area.AxisY.Title = "Y";
            area.AxisY.Minimum = -10;
            area.AxisY.Maximum = 255 + 50;
            area.AxisY.Interval = 20;

            var style = area.Area3DStyle;
            style.Enable3D = true;
            style.IsRightAngleAxes = true;
            style.Perspective = 20;
            style.Rotation = track.Value;
            style.Inclination = track2.Value;
            style.Perspective = track3.Value;

            chart = new Chart();
            chart.ChartAreas.Add(area);

            Random rnd = new Random();
            for (int i = 0; i < image.Rows; i++)
            {
                var series = new Series();
                series.ChartType = SeriesChartType.Point;
                series.MarkerSize = 5;
                series.MarkerStyle = MarkerStyle.Circle;
                series.BorderColor = Color.Tomato;
                //series.Color = Color.Tomato;
                chart.Series.Add(series);

                for (int x = 0; x <= image.Cols; x++)
                {
                    var value = image.At<byte>(i, x);
                    series.Points.AddXY(x, value);
                }
            }

            area.Position = new ElementPosition(0f, 0f, 100f, 90f);
            chart.Dock = DockStyle.Fill;
            this.Controls.Add(chart);

            track.ValueChanged += (s, e) =>
            {
                this.chart.ChartAreas[0].Area3DStyle.Rotation = ((TrackBar)s).Value;
            };
            track2.ValueChanged += (s, e) =>
            {
                this.chart.ChartAreas[0].Area3DStyle.Inclination = ((TrackBar)s).Value;
            };
            track3.ValueChanged += (s, e) =>
            {
                this.chart.ChartAreas[0].Area3DStyle.Perspective = ((TrackBar)s).Value;
            };
        }
    }
}