Python dry goods | remote sensing image stitching
- Preface
Because I did not drink the "first milk tea in autumn", I am going to update an article.
In the last tweet, I showed how to use Python combined with Landsat to make remote sensing image maps (Python干货| Make remote sensing image maps).
For Landsat data, the revisit period for a certain area is 16 days, and each location is indexed using the global reference system (WRS), that is, each location corresponds to a Path and Row, there will be some overlapping areas between adjacent images.
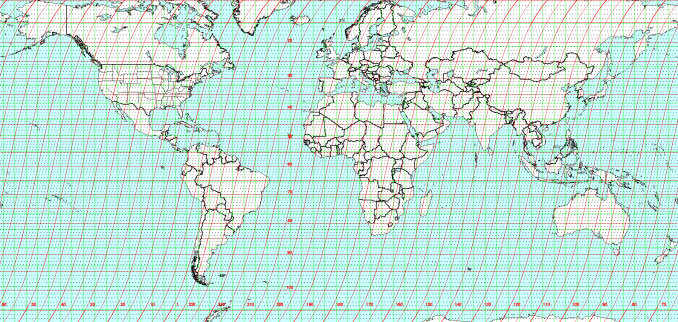
Fig.1 World Reference System
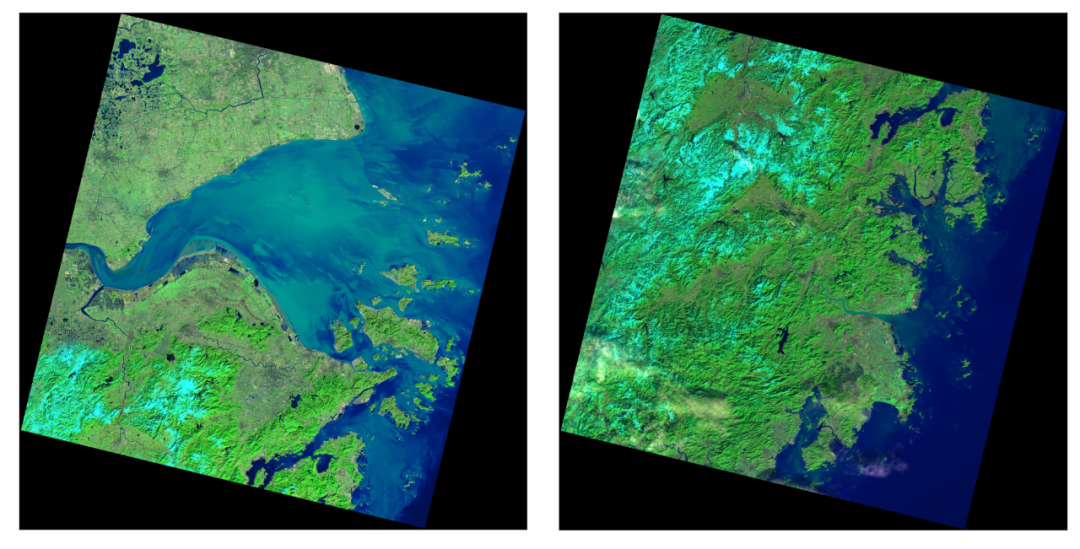
In some remote sensing image application scenarios, if the area we focus on is exactly at the junction of the two images, such as the Xiangshan Port in the figure below, then we need to stitch the images together before we can use it.
The single image is like this.
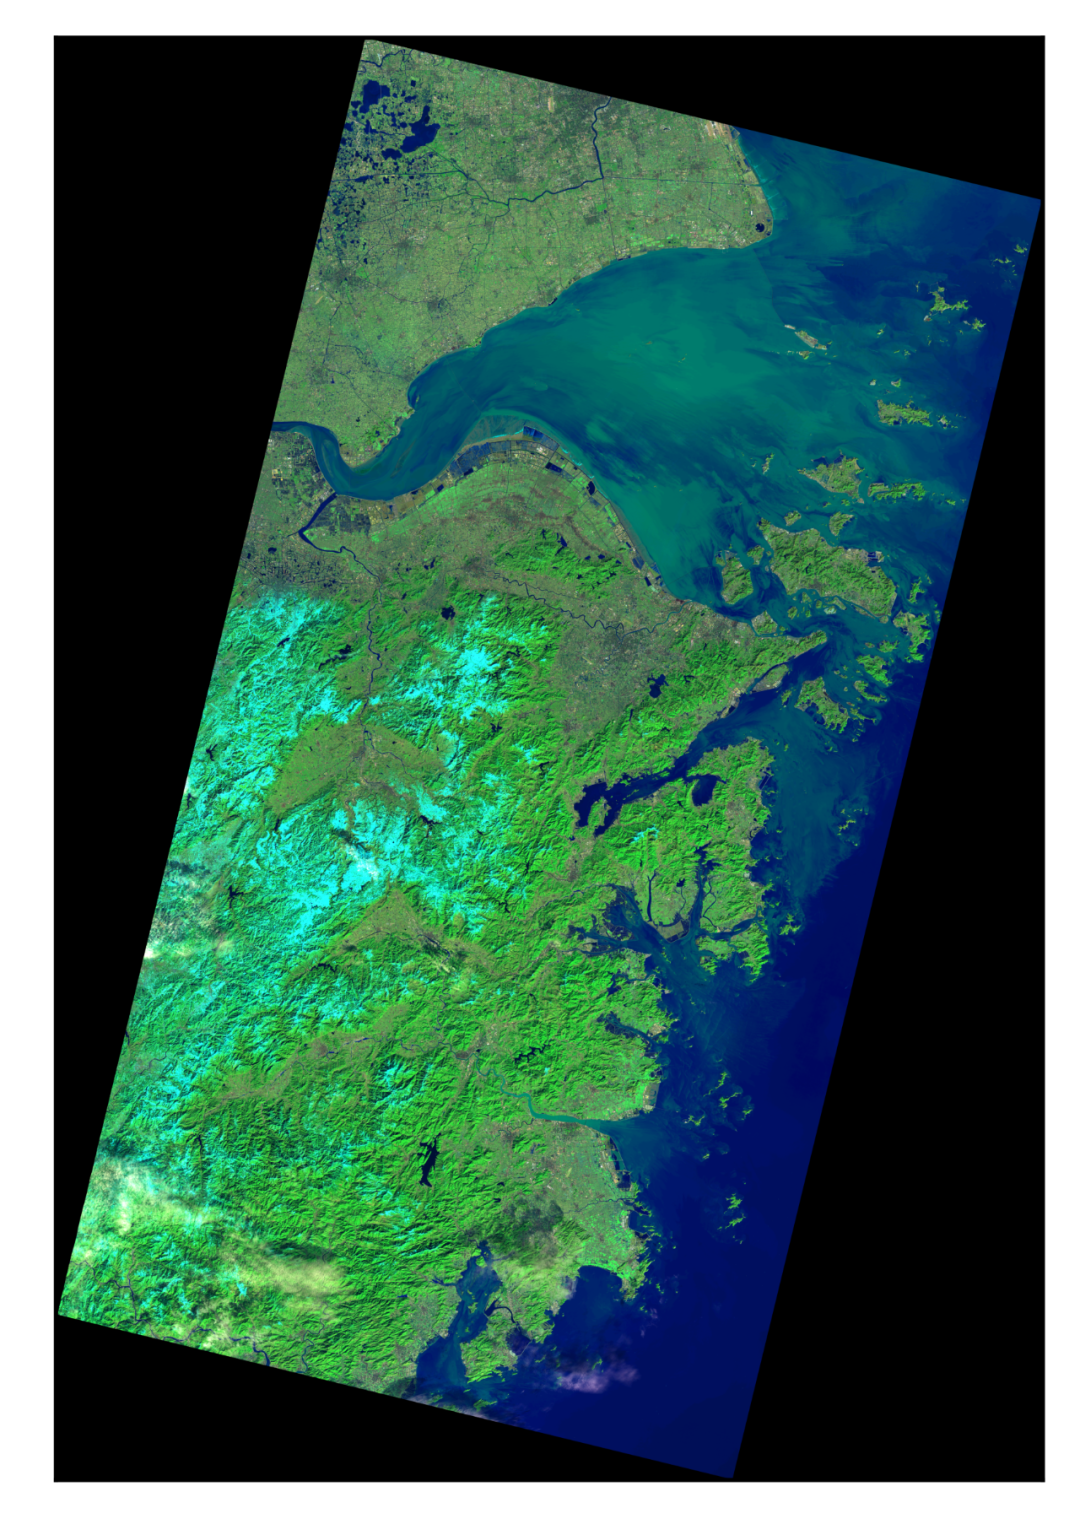
This is the case after this article is merged.
1. Ready to work##
Compared with the previous post, we used two libraries, rasterio and gdal, in order to realize the mosaic splicing of remote sensing images.
import rasterio as rio
import gdal
First introduce our idea of realizing two sets of remote sensing image splicing. First, select two adjacent images to obtain their spatial extents respectively, and then obtain the spatial extents of the two scenes combined together, and use gdal to create a new tif File (for data transfer), get the starting positions of the original two scene images in the newly created tif file respectively, and write the corresponding data into the new tif file to realize mosaic splicing.
The above mentioned is the splicing of two scenes images. If it is more image splicing, it is also applicable. However, if the current method is to splice more images, it requires a lot of memory space, which may easily lead to memory overflow. Interested friends can think about it. How to efficiently realize the stitching of multi-scene images.
There are two key processings, one is how to remove invalid information in the overlapping area, and the second is how to select data in the overlapping area. I hope you can find the answer from the code.
2. Get started##
Get the four corner points of the input image.
def tiffileList2filename(tiffileList):
 filename =[]
 prefix =[]for ifile in tiffileList:
  file0 = ifile.split("\\")[-1]
  prefix.append(os.path.join(ifile, file0))
  filename.append(os.path.join(ifile, file0)+"_B1.TIF")return filename, prefix
def get_extent(tiffileList):
 filename, prefix =tiffileList2filename(tiffileList)
 rioData = rio.open(filename[0])
 left = rioData.bounds[0]
 bottom = rioData.bounds[1]
 right = rioData.bounds[2]
 top = rioData.bounds[3]for ifile in filename[1:]:
  rioData = rio.open(ifile)
  left =min(left, rioData.bounds[0])
  bottom =min(bottom, rioData.bounds[1])
  right =max(right, rioData.bounds[2])
  top =max(top, rioData.bounds[3])return left, bottom, right, top, filename, prefix
Get the size of the newly created tif file. Here, it is known that the spatial resolution of Landsat is 30m. If it is other remote sensing data, it needs to be modified accordingly.
def getRowCol(left, bottom, right, top):
 cols =int((right - left)/30.0)
 rows =int((top - bottom)/30.0)return cols, rows
The main program, where plot_rgb is the function used in the previous article.
if __name__ =='__main__':
 tiffileList =[r'PathofLandsat8\LC08_L1TP_118039_20160126_20170330_01_T1',
     r'PathofLandsat8\LC08_L1TP_118040_20160126_20170330_01_T1']
 left, bottom, right, top, filename, prefix =get_extent(tiffileList)
 cols, rows=getRowCol(left, bottom, right, top)
 bands =['B7','B5','B3']
 n_bands =len(bands)
 arr = np.zeros((n_bands, rows, cols), dtype=np.float)
 # Open a tif file
 in_ds = gdal.Open(filename[0])for i inrange(len(bands)):
  ibands = bands[i]
  # Create a new tif file
  driver = gdal.GetDriverByName('gtiff')
  out_ds = driver.Create(ibands +'mosaic.tif', cols, rows)
  # Set the projection of the tif file
  out_ds.SetProjection(in_ds.GetProjection())
  out_band = out_ds.GetRasterBand(1)
  # Set the geographic transformation of the new tif file
  gt =list(in_ds.GetGeoTransform())
  gt[0], gt[3]= left, top
  out_ds.SetGeoTransform(gt)
  # Loop reading of the images to be stitched
  for ifile in prefix:
   in_ds = gdal.Open(ifile +'_'+ ibands +'.tif')
   # Calculate the coordinate drift between the newly created tif file and the tif file opened this time
   trans = gdal.Transformer(in_ds, out_ds,[])
   # Get offset start point
   success, xyz = trans.TransformPoint(False,0,0)
   x, y, z =map(int, xyz)
   # Read band information
   fnBand = in_ds.GetRasterBand(1)
   data = fnBand.ReadAsArray()
   # Before writing the tif file, the maximum value is set to 255, this step is very important
   data = data /65535*255
   data[np.where(data ==255)]=0
   # Image overlap part processing, the overlap part takes the maximum value
   xSize = fnBand.XSize
   ySize = fnBand.YSize
   outData = out_band.ReadAsArray(x, y, xSize, ySize)
   data = np.maximum(data, outData)
   out_band.WriteArray(data, x, y)
  del out_band, out_ds
  file2read = ibands +'mosaic.tif'
  arr[i,:,:]= tiff.imread(file2read)
  os.remove(file2read)plot_rgb(arr, rgb=(0,1,2))
3. summary##
That's it!
Recommended Posts