Draw personal footprint map based on Python
Foreword
In the first two years, the small footprint map program was popular in the circle of friends, and for a while, everyone was popular to publish their own travel maps. However, I have recently experienced several small programs for footprint maps, and found that although these small programs are called footprint maps, they are displayed at the provincial level at most and cannot be accurate to the city level. Therefore, I spent some time on the weekend using Python To draw your own personal footprint map, which can be accurate to the city level.
In the following part, the author will introduce how to draw a personal footprint map simply.
First we need to install the following third-party modules for Python:
echarts-china-cities-pypkg==0.0.9
echarts-china-provinces-pypkg==0.0.3
pyecharts==1.6.2
PyYAML==5.3.1
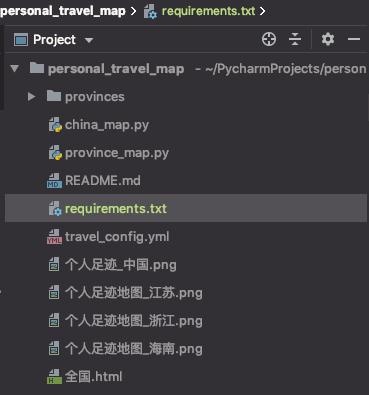
The complete structure of this project is as follows:
We use YAML files in the project to configure the provinces and cities under the provinces that we have traveled. The author’s configuration file is as follows:
Beijing:-Yanqing District
- Changping District
- Haidian District
- Dongcheng Area
- Xicheng District
- Daxing District
- Chaoyang District
Shanghai:-Jiading District
- Qingpu District
- Songjiang District
- Baoshan District
- Minhang District
- Fengxian District
- Pudong New Area
- Chongming District
- Xuhui District
- Huangpu District
- Jing'an District
- Yangpu District
- Hongkou District
- Jinshan District
- Changning District
- Putuo District
Tianjin:-Binhai New Area
- Nankai District
- Hexi District
- Heping District
Hebei:-Baoding
- Langfang City
Shandong:-Yantai
- Qingdao City
Jiangsu:-Nanjing City
- Suzhou City
- Yangzhou
- Zhenjiang
- Wuxi City
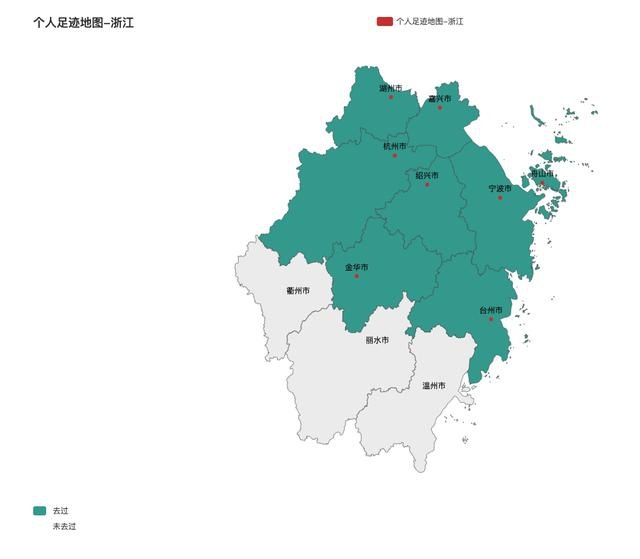
Zhejiang:-Hangzhou City
- Shaoxing City
- Ningbo City
- Zhoushan City
- Huzhou
- Jiaxing City
- Taizhou
- Jinhua City
Jiangxi:-Nanchang
- Jiujiang City
Anhui:-Huangshan City
Hubei:-Wuhan
Hunan:-Changsha City
Hainan:-Haikou
- Sanya City
Sichuan:-Chengdu
Guangdong:-Zhanjiang
Then we use Python scripts to generate footprint maps. First is the national map, which is used to display the situation of provinces and municipalities directly under the Central Government. The code of china_map.py is as follows:
g: utf-8-*-
# author: Jclian91
# place: Pudong Shanghai
# time:2020/5/319:21 am
# Mapping personal footprints: nationwide
import yaml
from pyecharts.charts import Map
from pyecharts import options as opts

# Provinces and municipalities
withopen("travel_config.yml",'r', encoding='utf-8')as ymlfile:
 province_city_dict = yaml.safe_load(ymlfile)

province_dict =dict(zip(province_city_dict.keys(),[1]*len(province_city_dict.keys())))print(province_dict)

# maptype='china'Only show national municipalities and provinces
map =Map(init_opts=opts.InitOpts(width='1200px', height='800px'))
map.set_global_opts(
 title_opts=opts.TitleOpts(title="Personal footprint map"),
 visualmap_opts=opts.VisualMapOpts(max_=1, is_piecewise=True,
     pieces=[{"max":1,"min":1,"label":"Have been","color":"#4EA397"},{"max":0,"min":0,"label":"未Have been","color":"#FFFFFF"},]) #Maximum data range, segment
                   )
map.add("Personal footprint map", data_pair=province_dict.items(), maptype="china", is_roam=True)
map.render('Nationwide.html')
Running the above script will generate national .html. In order to ensure that the image is displayed in the center, we use the following line in the HTML:
< div id="a438407081634ceab6af1c965034ae16" class="chart-container" style="width:1200px; height:800px;" </div
Add the following content to the style:
margin:auto;top:30px
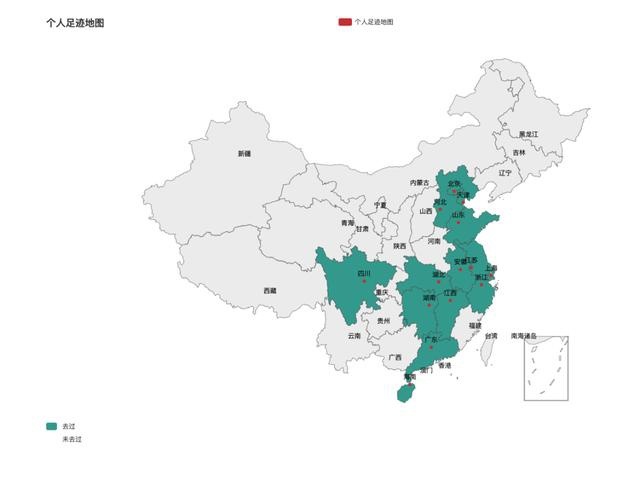
The renderings of the nationwide footprint map are as follows:
Personal footprint map-nationwide
Next, let's generate a footprint map of each province and city, using the province_map.py script, the code is as follows:
# - *- coding: utf-8-*-
# author: Jclian91
# place: Pudong Shanghai
# time:2020/5/3110:01 am
# Draw personal footprint maps: provinces and cities
import yaml
from pyecharts.charts import Map
from pyecharts import options as opts

# Cities below provinces and municipalities
withopen("travel_config.yml",'r', encoding='utf-8')as ymlfile:
 province_city_dict = yaml.safe_load(ymlfile)for province, cities in province_city_dict.items():

 map =Map(init_opts=opts.InitOpts(width='1200px', height='800px'))
 map.set_global_opts(
 title_opts=opts.TitleOpts(title="Personal footprint map-%s"% province),
 visualmap_opts=opts.VisualMapOpts(max_=1, is_piecewise=True,
      pieces=[{"max":1,"min":1,"label":"Have been","color":"#4EA397"},{"max":0,"min":0,"label":"未Have been","color":"#FFFFFF"},]) #Maximum data range, segment
                     )
 city_dict =dict(zip(cities,[1]*len(cities)))
 map.add("Personal footprint map-%s"% province, data_pair=city_dict.items(), maptype=province, is_roam=True)
 map.render('./provinces/%s.html'% province)print("Generate personal footprint map-%s success"% province)
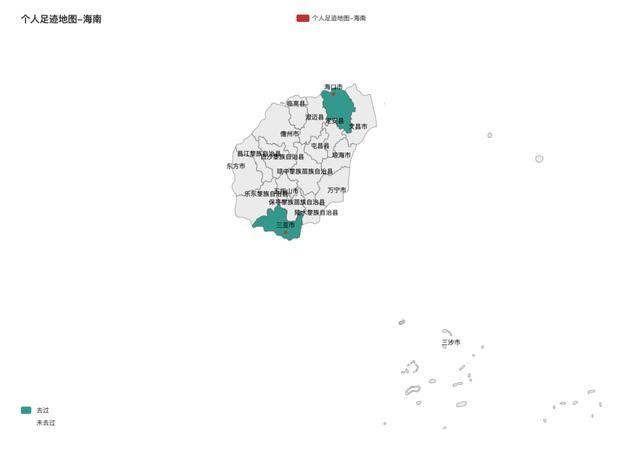
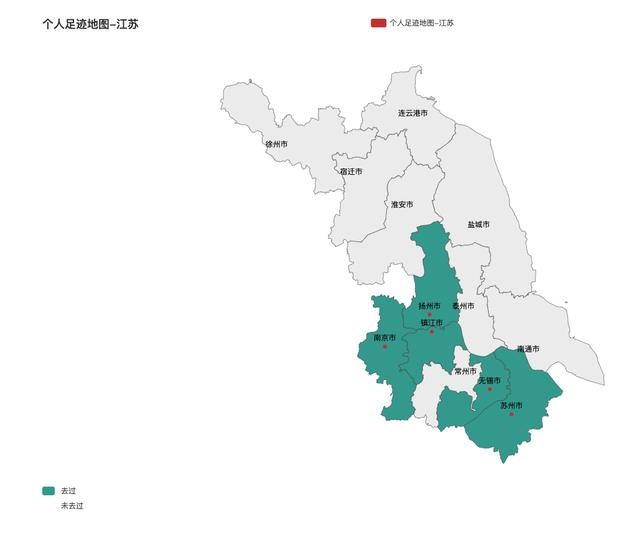
At this time, a footprint map of each province or municipality will be generated in the provinces directory, and we will modify each HTML separately to ensure that the image is centered. We only show the situation in three provinces and cities here:
Personal footprint area-Hainan
Personal footprint map-Jiangsu
Personal footprint map-Zhejiang
The last step, and the most critical step, is that we have to open up the link between the national footprint map and the footprint map of each province and city. That is to say, if we click on the provinces we have visited on the national footprint map, then we can click in to view the provinces and cities. Footprint map situation, such as which cities have been visited.
In this regard, we modify the generated national .html file, assuming that the image handle of the map is chart_a438407081634ceab6af1c965034ae16, then in the final <script 对中添加内容如下:(确保点击去过的省份,可以查看该省市的足迹地图)
chart_a438407081634ceab6af1c965034ae16.on('click',function(param){var selected = param.name;if(selected){switch(selected){case'Beijing':
    location.href ="provinces/Beijing.html";break;case'Shanghai':
    location.href ="provinces/Shanghai.html";break;case'Tianjin':
    location.href ="provinces/Tianjin.html";break;case'Sichuan':
    location.href ="provinces/Sichuan.html";break;case'Anhui':
    location.href ="provinces/Anhui.html";break;case'Shandong':
    location.href ="provinces/Shandong.html";break;case'Jiangsu':
    location.href ="provinces/Jiangsu.html";break;case'Jiangxi':
    location.href ="provinces/Jiangxi.html";break;case'Hebei':
    location.href ="provinces/Hebei.html";break;case'Zhejiang':
    location.href ="provinces/Zhejiang.html";break;case'Hainan':
    location.href ="provinces/Hainan.html";break;case'Hubei':
    location.href ="provinces/Hubei.html";break;case'Hunan':
    location.href ="provinces/Hunan.html";break;case'Guangdong':
    location.href ="provinces/Guangdong.html";break;default:break;}}});
The above is the whole content of this article, I hope it will be helpful to everyone's study.
Recommended Posts