Automatically generate data analysis report with Python
In many cases, we need to do some repetitive work, for example, to produce similar data analysis reports every month, the whole framework is basically fixed, at this time, we can use Python to automatically generate data analysis reports, ** more More time and energy are spent on analysis** instead of adjusting the report format.
python-pptx is a Python library that can automatically create and update PPT files, and can be used to automatically generate data analysis reports.
Below, I take my personal data as an example, and use python-pptx to make a simplified version of the data analysis report for your reference.
The following are the specific production steps and methods.
First of all, if you have not installed python-pptx, then please enter on the command line:
pip install python-pptx
Secondly, use drawing tools such as matplotlib to generate the charts used in the data analysis report and save them in the pic folder.
Then, create a PPT template file, predefine the master, set the corresponding layout, etc., and name the file "template.pptx".
Next, run the following code in the Jupyter Lab environment:
# Import library
from pptx import Presentation
from pptx.util import Inches, Pt
from pptx.dml.color import RGBColor
# Template download https://github.com/linjiwx/mp
prs =Presentation('template.pptx')
# Add slide homepage
slide_layout0 = prs.slide_layouts[0]
slide = prs.slides.add_slide(slide_layout0)
# Set title and subtitle text
title = slide.shapes.title
subtitle = slide.placeholders[10]
title.text ='Lin Ji's data analysis report for September 2020'
subtitle.text ='2020-10-08'
# Add slides and text modules, choose the layout according to actual needs
# *************1. Main analysis conclusion*****************
slide_layout1 = prs.slide_layouts[1]
slide1 = prs.slides.add_slide(slide_layout1)
# Add title
title = slide1.placeholders[10]
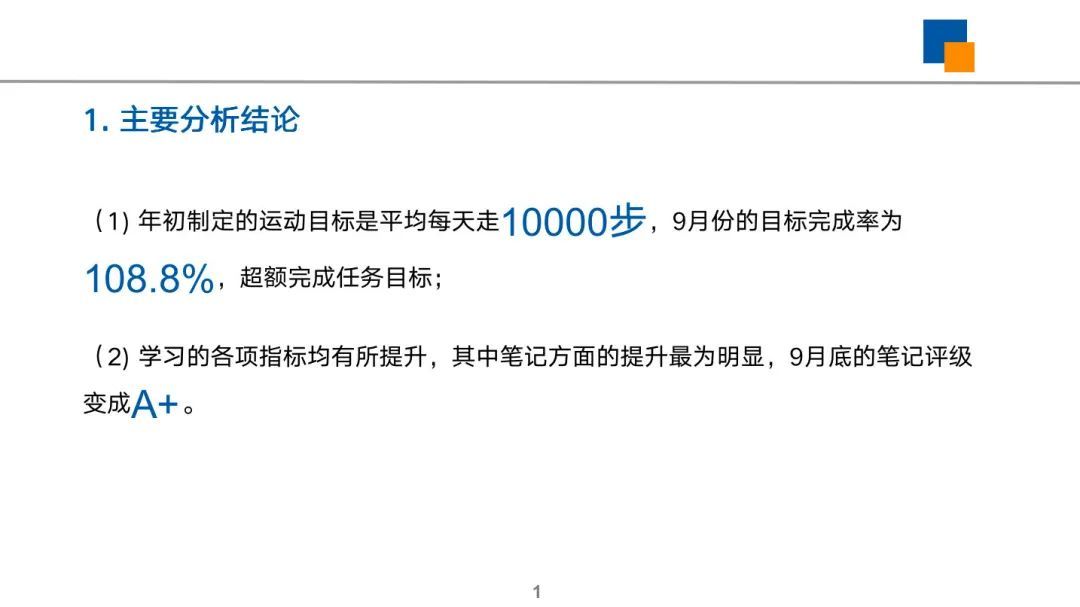
title.text ="1.Main analysis conclusion"
# Add body content
content = slide1.placeholders[11]
ft = content.text_frame
ft.clear()
p = ft.paragraphs[0]
run = p.add_run()
run.text ='(1)The exercise goal set at the beginning of the year is to walk on average every day'
# Highlighted content
run = p.add_run()
run.text ='10000 steps'
font = run.font
font.name ='Arial'
font.size =Pt(26)
font.color.rgb =RGBColor(0,88,159)
# Continue to add other content
run = p.add_run()
run.text =', The target completion rate in September'
# Highlighted content
run = p.add_run()
run.text ='108.8%'
font = run.font
font.name ='Arial'
font.size =Pt(26)
font.color.rgb =RGBColor(0,88,159)
# Continue to add other content
run = p.add_run()
run.text =''', Exceed the task goal;
(2)The various indicators of learning have been improved, among which the improvement in notes is the most obvious. The note rating at the end of September becomes'''
# Highlighted content
run = p.add_run()
run.text ='A+'
font = run.font
font.name ='Arial'
font.size =Pt(26)
font.color.rgb =RGBColor(0,88,159)
# Continue to add other content
run = p.add_run()
run.text ='。'
# ***************2. Target accomplishment******************
# Add slide
slide_layout2 = prs.slide_layouts[3]
slide2 = prs.slides.add_slide(slide_layout2)
# Add body module title
title= slide2.placeholders[10]
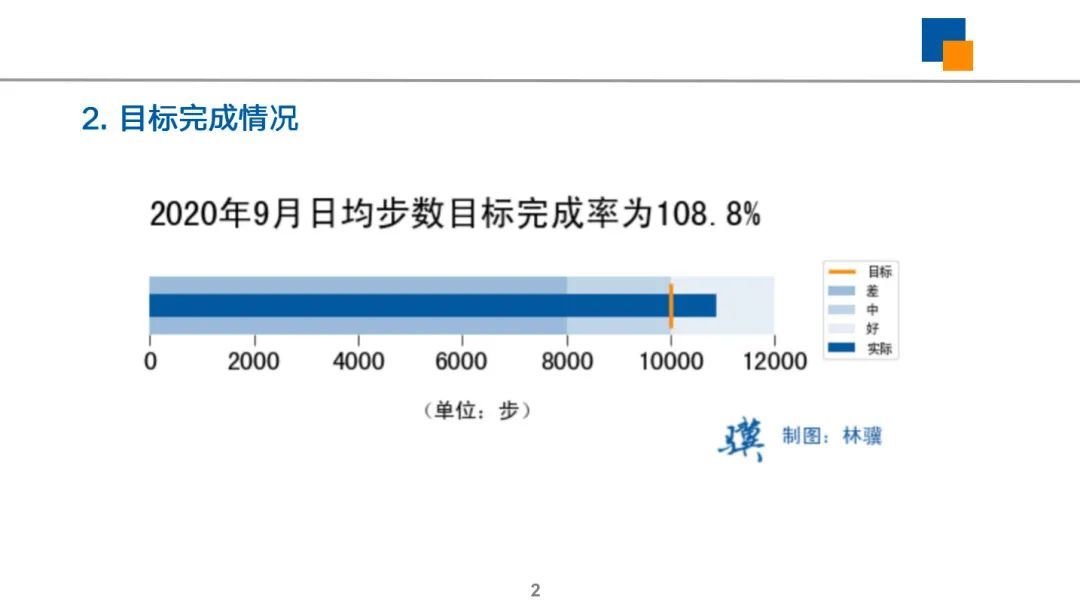
title.text ="2.Target accomplishment"
# Insert picture https://github.com/linjiwx/mp
img_path='./pic/2.Target accomplishment.jpg'
picture_placeholder = slide2.placeholders[11]
placeholder_picture = picture_placeholder.insert_picture(img_path)
# Add description content
content= slide2.placeholders[12]
content.text =' '
# ***************3. Key indicator changes******************
# Add slide
slide_layout3 = prs.slide_layouts[6]
slide3 = prs.slides.add_slide(slide_layout3)
# Add body module title
title= slide3.placeholders[10]
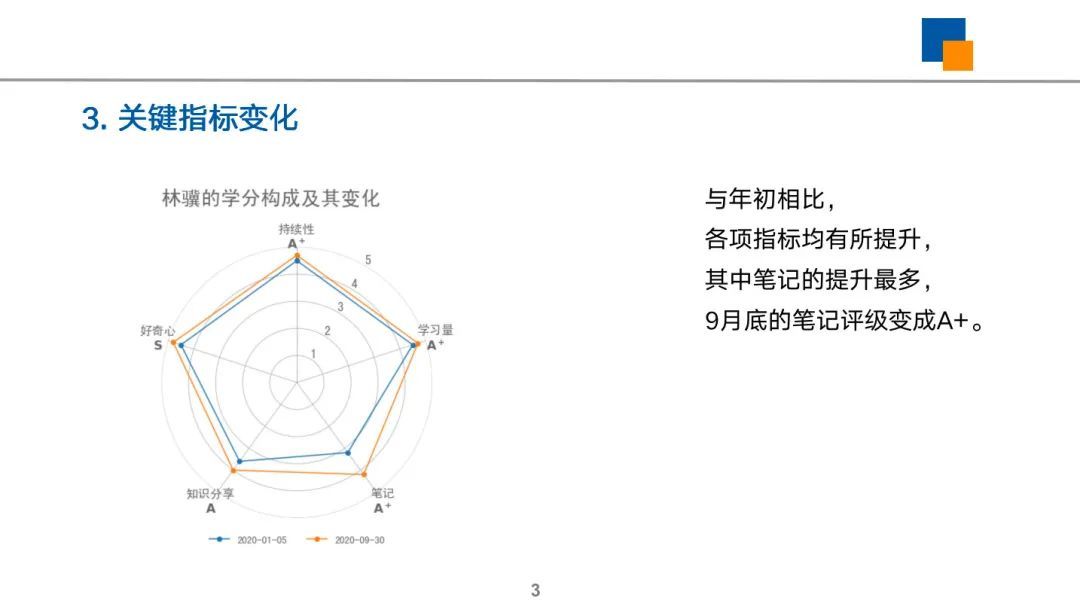
title.text ="3.Key indicator changes"
# Insert picture object, main picture
img_path='./pic/3.Key indicator changes.jpg'
picture_placeholder = slide3.placeholders[11]
placeholder_picture = picture_placeholder.insert_picture(img_path)
# Add description content
content= slide3.placeholders[12]
content.text ='''Compared with the beginning of the year,
All indicators have improved,
Among them, notes have been improved the most,
9 The note rating at the end of the month becomes A+。
'''
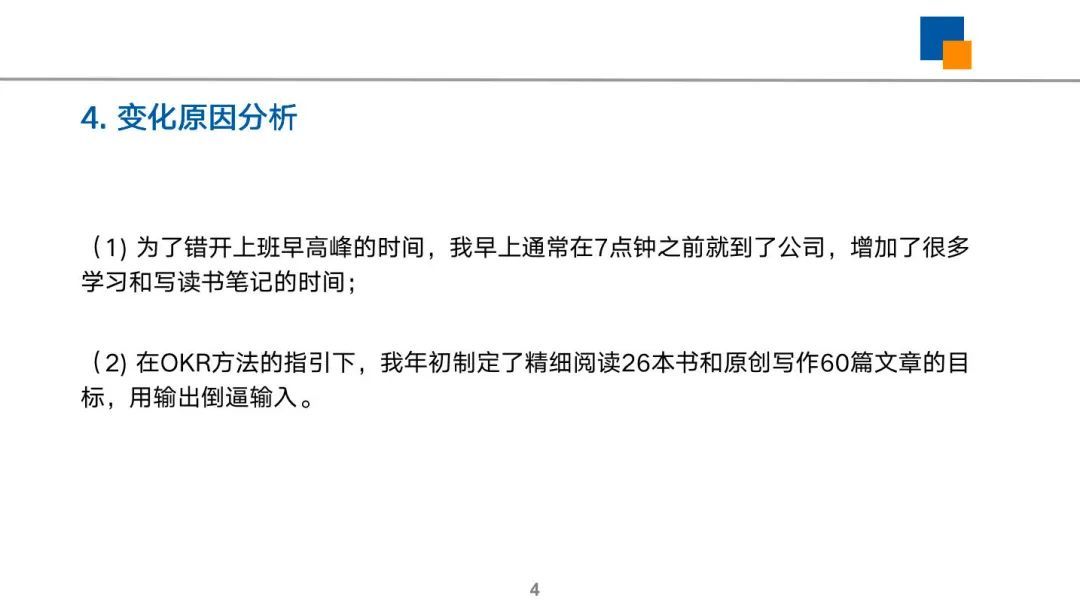
# ***************4. Change reason analysis******************
# Add slide
slide_layout4 = prs.slide_layouts[1]
slide4 = prs.slides.add_slide(slide_layout4)
# Add body module title
title= slide4.placeholders[10]
title.text ="4.Change reason analysis"
# Add description content
content= slide4.placeholders[11]
content.text ='''
(1)In order to stagger the morning rush hours at work, I usually arrive at the company before 7 o'clock in the morning, which increases my time for study and writing notes;
(2)Under the guidance of the OKR method, at the beginning of the year, I set the goal of carefully reading 26 books and original writing 60 articles, using output to force input.
'''
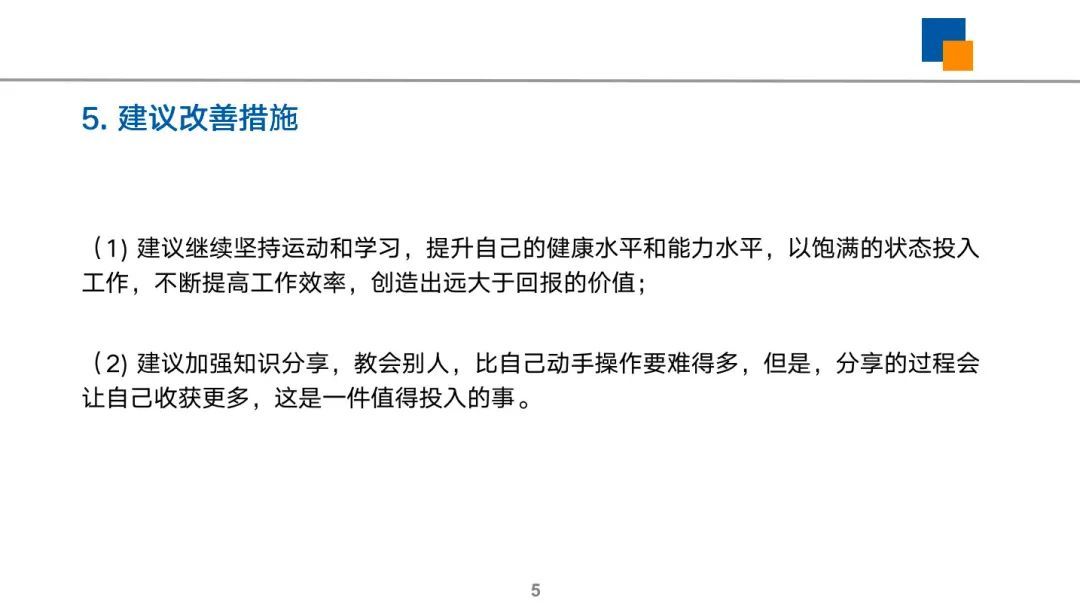
# *************5. Suggested improvement measures*****************
slide_layout5 = prs.slide_layouts[1]
slide5 = prs.slides.add_slide(slide_layout5)
# Add body module title
title= slide5.placeholders[10]
title.text ="5.Suggested improvement measures"
# Add content
content= slide5.placeholders[11]
content.text ='''
(1)It is recommended to continue to exercise and study, improve one's health and ability level, put into work in a full state, continuously improve work efficiency, and create value far greater than returns;
(2)It is recommended to strengthen knowledge sharing and teach others. It is much more difficult than doing it yourself. However, the process of sharing will make you gain more. This is a thing worth investing in.
'''
# ***************6. back cover******************
# Add slide
slide_layout2 = prs.slide_layouts[3]
slide2 = prs.slides.add_slide(slide_layout2)
# Add body module title
title= slide2.placeholders[10]
title.text ='6.Thank you for your attention'
# Insert picture object, main picture
img_path='./pic/Lin Ji.png'
picture_placeholder = slide2.placeholders[11]
placeholder_picture = picture_placeholder.insert_picture(img_path)
# Add description content
content= slide2.placeholders[12]
content.text ='Use data to solve problems and make analysis more effective.'
prs.save('Lin Ji's data analysis report for September 2020.pptx')print("The report has been generated, please open the PPT file to view it.")
Open the automatically generated PPT file, you can see the complete data analysis report results.
Recommended Posts