Python Data Science: Related Analysis
There are currently two books in hand, one "Data Analysis with Python" and the other "Python Data Science".
For learning everything, there is its "Dao" and "Skill". "Tao" means principle, and "shu" means technique.
Looking through these two books these days, I found that the former is more like a reference book.
It does not really teach you how to analyze data, it is suitable for review.
As for the latter, it pays more attention to the principles of data analysis and teaches us how to analyze data to get the results we want.
Therefore, we will use the latter as the direction of learning, and we can't just stop at descriptive data analysis (Data Visualization).
More time should be spent on predictive data analysis (building data model prediction).
In addition, the book delivery activity of the previous issue has ended, and the two friends contacted me.
Don’t be sad if you don’t win the prize. F will fight for more benefits for everyone, so just pay attention.
/ 01 / Foreword
To be honest, the book "Python Data Science" is really good.
It not only provides a large number of explanations of professional terms, but also a variety of easy-to-understand cases.
It is very suitable for novices to learn, and we will definitely fight for the benefits of sending books later!
So in the preface of each article, I will summarize some relevant content of "Python Data Science".
On the one hand, deepen your own impression of relevant knowledge.
On the other hand, I also share it with everyone to add professional knowledge.
In the analysis process, try not to use the data and cases in the book, but use the data and cases of my own public account article.
This is a bit more grounded and more profound.
Variables are divided into "nominal variables", "level variables" and "continuous variables".
"Nominal variables" are unordered categorical variables.
For example, the "country" and "movie name" in the Douban movie TOP250 data.
"Rank variable" is an ordinal categorical variable.
For example, the "educational background" and "work experience" in the data analysis post.
"Continuous variable" means that a continuous variable can be arbitrarily taken within the specified range.
For example, the "year", "rating" and "number of people" in the TOP250 data of Douban movies.
/ 02 / Correlation analysis
In the above, we briefly described the types of variables and also gave relevant examples.
Next, we conduct a correlation analysis for the test of the relationship between two continuous variables.
Use the data in Douban TOP250 to study the relationship between rank and evaluation score.
Read data and clean.
import matplotlib.pyplot as plt
import seaborn as sns
import pandas as pd

# Read file
df = pd.read_csv('douban.csv', header=0, names=["quote","score","info","title","people"])(dom1, dom2, dom3, dom4)=([],[],[],[])
# Clean data,Get movie year and country,Add year column and country column
for i in df['info']:
 country = i.split('/')[1].split(' ')[0].strip()if country in['China Mainland','Taiwan','Hong Kong']:
  dom1.append(1)else:
  dom1.append(0)
 dom2.append(int(i.split('/')[0].replace('(China Mainland)','').strip()))
df['country']= dom1
df['year']= dom2
# Clean data,Create a column of reviewers
for i in df['people']:
 dom3.append(int(i.replace('Evaluation','')))
df['people_num']= dom3
# Generate movie ranking list
dom4 =[x for x inrange(1,251)]
df['rank']= dom4
print(df)
In the three-dimensional graph of the number of ranking ratings in that period, we know that the higher the ranking, the higher the number of evaluations, the higher the score.
This is just our intuitive conjecture, and it is not really shown with data.
Correlation analysis can use data to prove the correctness of our guess.
First, we look at the relationship between rankings and evaluation scores through a scatter chart to see if there is any correlation.
# scatter is a scatter chart
df.plot(x='rank', y='score', kind='scatter')
plt.show()
Here, the linear negative correlation appears due to the ranking problem, but this does not affect the analysis.
You just default to positive correlation, that is, the higher the ranking, the higher the score.
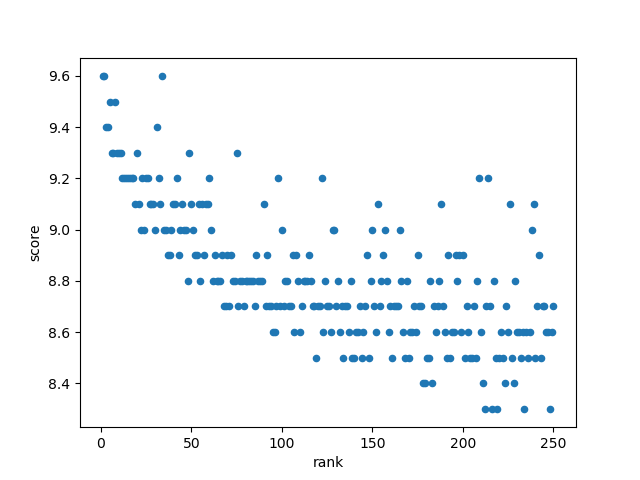
Through the scatter plot, we found that the data has a linear correlation.
Then you can use Pearson's correlation coefficient to analyze the correlation between the two variables.
# corr()method:Calculate pairwise related columns,Not including NA/Null value persion:Standard correlation coefficient
print(df[['rank','score']].corr(method='pearson'))
Output the correlation coefficient of the two variables, the absolute value is about 0.70, and the table shows that the correlation degree is high.

Then the conclusion is obvious, the relationship between **rank and evaluation score is a linear positive correlation! ! ! **
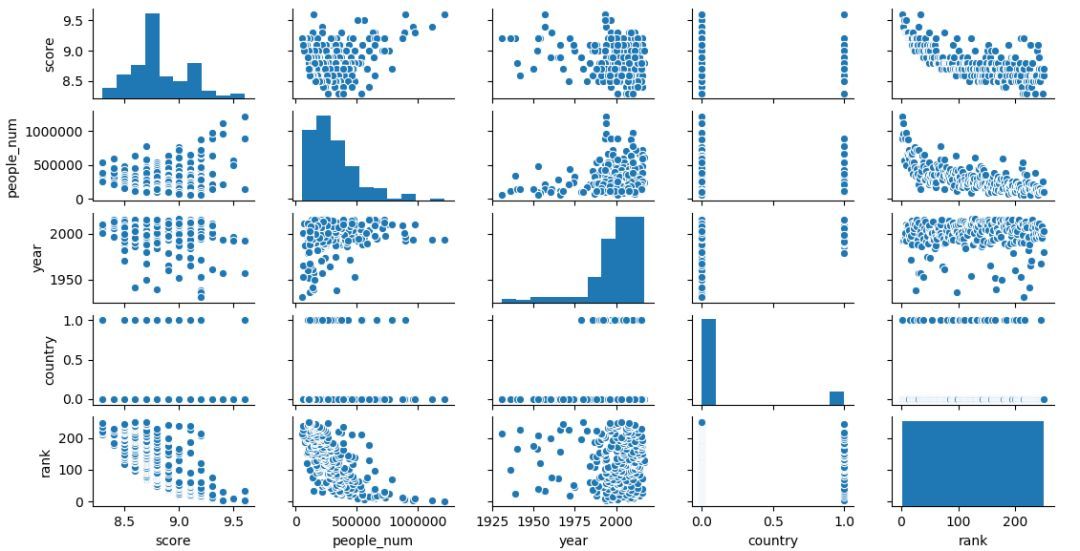
In addition to correlation analysis through correlation coefficient analysis, correlation analysis can also be through scatter matrix graphs.
Analyze the correlation between multiple variables to explore the relationship between variables.
# seaborn returns/Scatter plot
sns.pairplot(df[['score','people_num','year','country','rank']])
plt.show()
Generate the following scatter plot, you can find that rank is highly correlated with score and people_num (two graphs in the upper right corner).
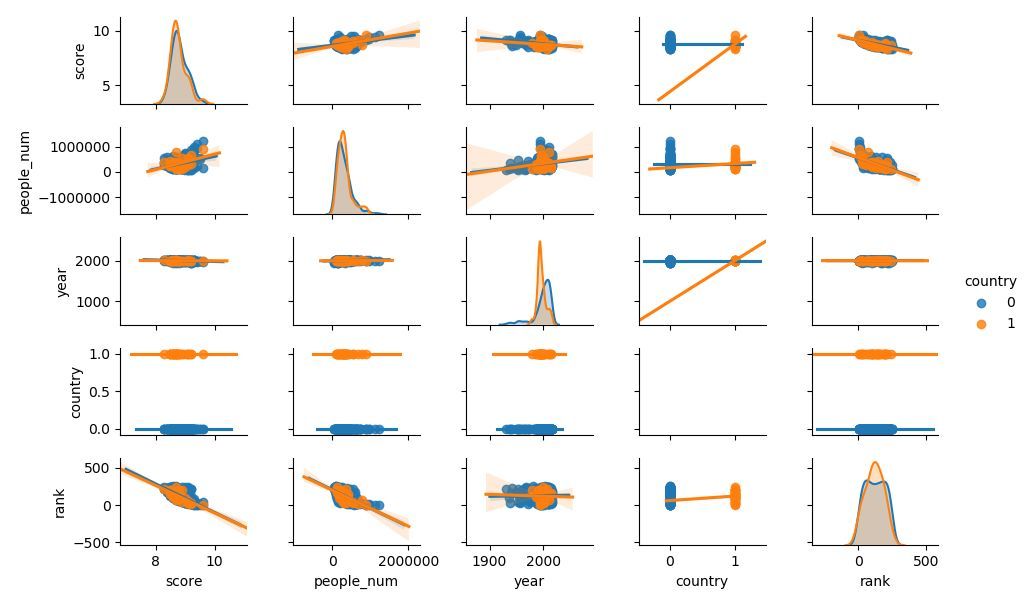
Next, create a grouping variable, specify the country as the grouping variable, and look at the TOP250 data of Douban movies in China and foreign countries.
# Generate a scatter plot matrix with auxiliary lines,hue:classification
sns.pairplot(df[['score','people_num','year','country','rank']], hue='country', kind='reg', diag_kind='kde', size=1.5)
plt.show()
Here you can observe the fitted line of the data and the upper and lower floating range, and understand the situation between variables more intuitively.
However, there is nothing found in the country classification, which may be related to too few data samples.
/ 03 / Summary
This time is just a simple relevant analysis case, which involves too much mathematics knowledge, I will not repeat it.
After reading this book, I realized that there is so much to learn...
However, I think it is very good to combine the previous relevant case analysis.
Be able to apply what you have learned and have your own ideas.
Recommended Posts