Python drawing | A variety of typhoon path visualization methods
A typhoon is a major catastrophic weather. The direct disasters caused by a typhoon are usually caused by three aspects: squalls, heavy rains, and storm surges. In addition, these disasters of typhoons can easily induce urban waterlogging, house collapse, mountain torrents, mudslides and other secondary disasters. For this reason, typhoon is the focus of research in scientific research and business work. I hope this visualization of the typhoon path can give you a little help.
Obtaining the typhoon path
China Meteorological Administration (CMA)
The best typhoon path data set (BST) of the China Meteorological Administration (CMA). The BST is released after the correction of the historical typhoon path. Its latitude, longitude, intensity, and pressure have higher reliability, but the time resolution is 6 hours. , Part 3 hours, this is not as good as the observation data. Download link: http://tcdata.typhoon.org.cn/
Wenzhou Typhoon Network
The data of the Wenzhou Typhoon Network is a record of real-time release data, with a time resolution of up to 1 hour, and a more refined representation of the typhoon trajectory. Download link: http://www.wztf121.com/
Example
Import the module and read the data, using BST's 2018 typhoon path data as an example, the original txt file has been converted into an xls file.
import os, glob
import pandas as pd
import numpy as np
import shapely.geometry as sgeom
import matplotlib.pyplot as plt
from matplotlib.image import imread
from matplotlib.animation import FuncAnimation
import matplotlib.lines as mlines
import cartopy.crs as ccrs
import cartopy.feature as cfeat
from cartopy.mpl.ticker import LongitudeFormatter,LatitudeFormatter
import cartopy.io.shapereader as shpreader
import cartopy.io.img_tiles as cimgt
from PIL import Image
import warnings
warnings.filterwarnings('ignore')
df = pd.read_csv('./2018typhoon.csv')
Define grade color code
def get_color(level):
 global color
 if level =='Tropical depression' or level =='Tropical disturbance':
  color='#FFFF00'
 elif level =='Tropical storm':
  color='#6495ED'
 elif level =='Severe tropical storm':
  color='#3CB371'
 elif level =='typhoon':
  color='#FFA500'
 elif level =='Strong typhoon':
  color='#FF00FF'
 elif level =='Super typhoon':
  color='#DC143C'return color
Define basemap function
def create_map(title, extent):
 fig = plt.figure(figsize=(12,8))
 ax = fig.add_subplot(1,1,1, projection=ccrs.PlateCarree())
 url ='http://map1c.vis.earthdata.nasa.gov/wmts-geo/wmts.cgi'
 layer ='BlueMarble_ShadedRelief'
 ax.add_wmts(url, layer)
 ax.set_extent(extent,crs=ccrs.PlateCarree())

 gl = ax.gridlines(draw_labels=False, linewidth=1, color='k', alpha=0.5, linestyle='--')
 gl.xlabels_top = gl.ylabels_right = False
 ax.set_xticks(np.arange(extent[0], extent[1]+5,5))
 ax.set_yticks(np.arange(extent[2], extent[3]+5,5))
 ax.xaxis.set_major_formatter(LongitudeFormatter())
 ax.xaxis.set_minor_locator(plt.MultipleLocator(1))
 ax.yaxis.set_major_formatter(LatitudeFormatter())
 ax.yaxis.set_minor_locator(plt.MultipleLocator(1))
 ax.tick_params(axis='both', labelsize=10, direction='out')

 a = mlines.Line2D([],[],color='#FFFF00',marker='o',markersize=7, label='TD',ls='')
 b = mlines.Line2D([],[],color='#6495ED', marker='o',markersize=7, label='TS',ls='')
 c = mlines.Line2D([],[],color='#3CB371', marker='o',markersize=7, label='STS',ls='')
 d = mlines.Line2D([],[],color='#FFA500', marker='o',markersize=7, label='TY',ls='')
 e = mlines.Line2D([],[],color='#FF00FF', marker='o',markersize=7, label='STY',ls='')
 f = mlines.Line2D([],[],color='#DC143C', marker='o',markersize=7, label='SSTY',ls='')
 ax.legend(handles=[a,b,c,d,e,f], numpoints=1, handletextpad=0, loc='upper left', shadow=True)
 plt.title(f'{title} Typhoon Track', fontsize=15)return ax
Define the method of drawing the path of a single typhoon, and draw the 18th Typhoon Umbia in 2018.
def draw_single(df):
 ax =create_map(df['first name'].iloc[0],[110,135,20,45])for i inrange(len(df)):
  ax.scatter(list(df['longitude'])[i],list(df['latitude'])[i], marker='o', s=20, color=get_color(list(df['strength'])[i]))for i inrange(len(df)-1):
  pointA =list(df['longitude'])[i],list(df['latitude'])[i]
  pointB =list(df['longitude'])[i+1],list(df['latitude'])[i+1]
  ax.add_geometries([sgeom.LineString([pointA, pointB])], color=get_color(list(df['strength'])[i+1]),crs=ccrs.PlateCarree())
 plt.savefig('./typhoon_one.png')draw_single(df[df['Numbering']==1818])
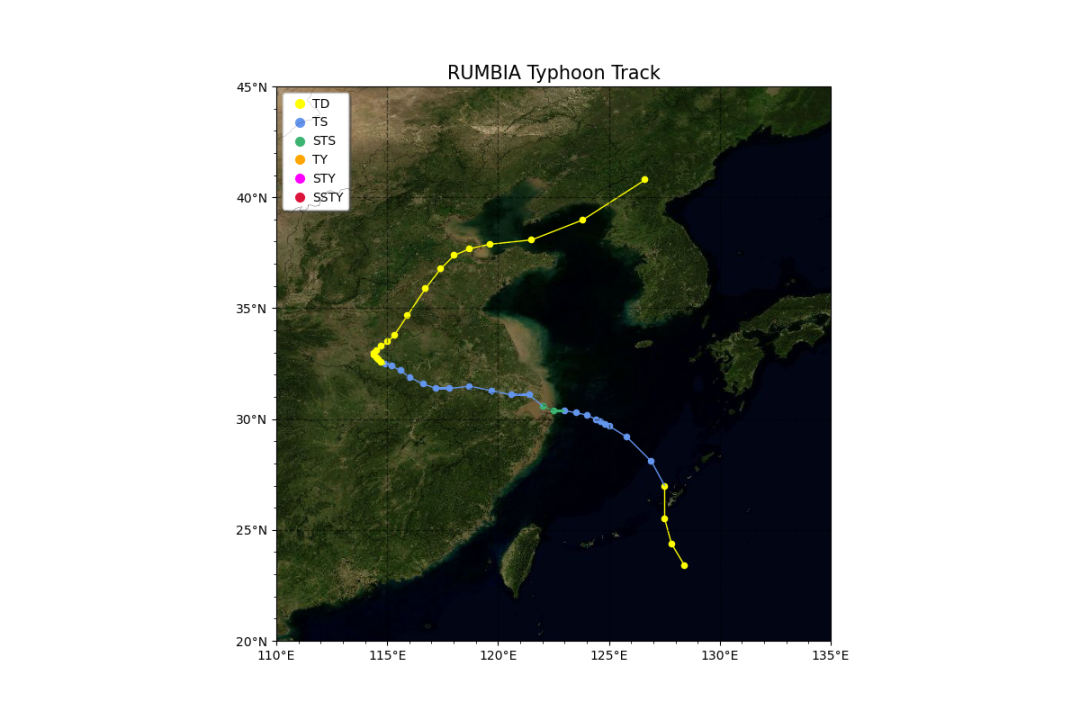
Define the method for drawing multiple typhoon paths and draw all typhoon paths throughout 2018.
def draw_multi(df):
 L =list(set(df['Numbering']))
 L.sort(key=list(df['Numbering']).index)
 ax =create_map('2018',[100,180,0,45])for number in L:
  df1 = df[df['Numbering']==number]for i inrange(len(df1)-1):
   pointA =list(df1['longitude'])[i],list(df1['latitude'])[i]
   pointB =list(df1['longitude'])[i+1],list(df1['latitude'])[i+1]
   ax.add_geometries([sgeom.LineString([pointA, pointB])], color=get_color(list(df1['strength'])[i+1]),crs=ccrs.PlateCarree())
 plt.savefig('./typhoon_multi.png')draw_multi(df)
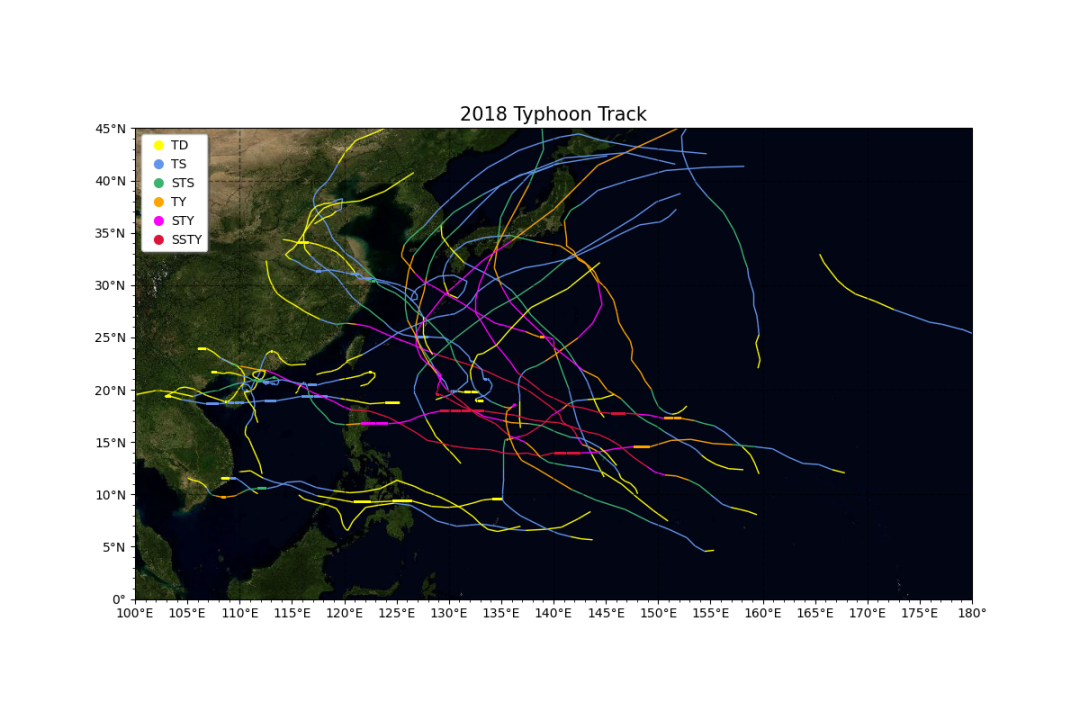
Define the evolution method of drawing a single typhoon gif path, and draw the gif path map of Typhoon No. 18 in 2018.
def draw_single_gif(df):for state inrange(len(df.index))[:]:
  ax =create_map(f'{df["first name"].iloc[0]} {df["time"].iloc[state]}',[110,135,20,45])for i inrange(len(df[:state])):
   ax.scatter(df['longitude'].iloc[i], df['latitude'].iloc[i], marker='o', s=20, color=get_color(df['strength'].iloc[i]))for i inrange(len(df[:state])-1):
   pointA = df['longitude'].iloc[i],df['latitude'].iloc[i]
   pointB = df['longitude'].iloc[i+1],df['latitude'].iloc[i+1]
   ax.add_geometries([sgeom.LineString([pointA, pointB])], color=get_color(df['strength'].iloc[i+1]),crs=ccrs.PlateCarree())print(f'Drawing{state}Trajectory graph')
  plt.savefig(f'./{df["first name"].iloc[0]}{str(state).zfill(3)}.png', bbox_inches='tight')
 # Stitch pictures into animation
 imgFiles =list(glob.glob(f'./{df["first name"].iloc[0]}*.png'))
 images =[Image.open(fn)for fn in imgFiles]
 im = images[0]
 filename = f'./track_{df["first name"].iloc[0]}.gif'
 im.save(fp=filename, format='gif', save_all=True, append_images=images[1:], duration=500)draw_single_gif(df[df['Numbering']==1818])
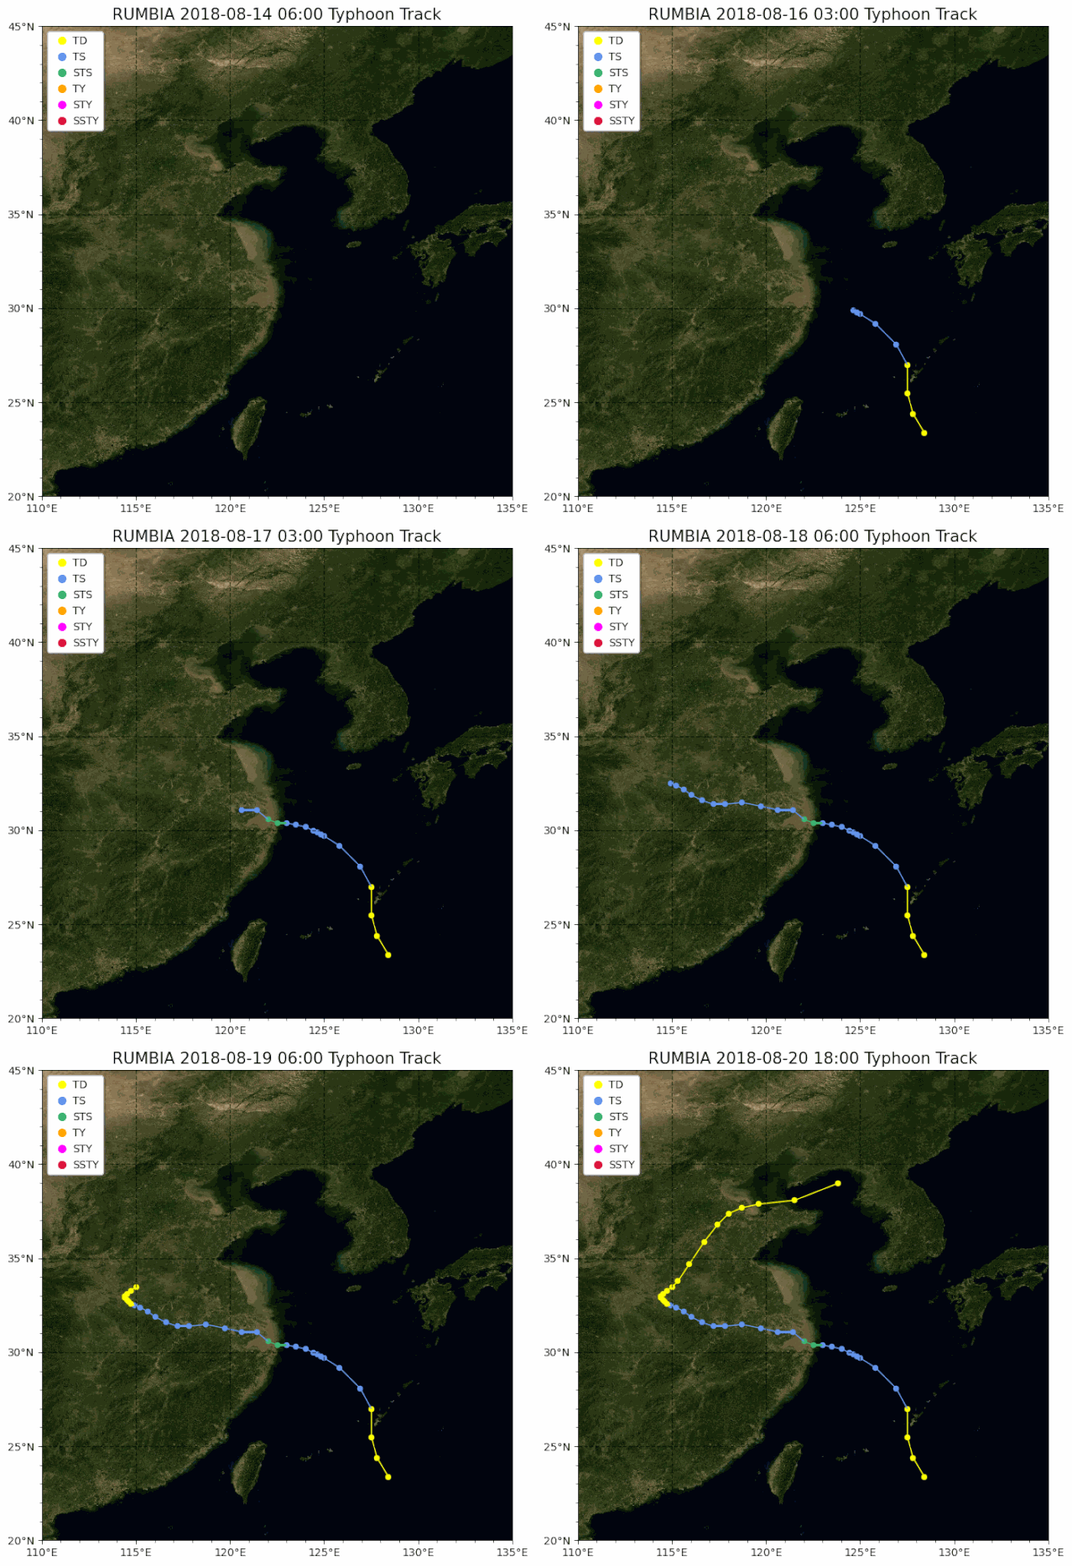
Obtaining method
Sample data, code, and pictures are obtained, and leave a message in the background of "Curiosity Log" Official Account: Typhoon Path

The script to convert txt data to xls can be written by yourself, it is not complicated. If you really need this script, send this article to Moments and send the screenshot to the background.
Originality is not easy. If you think this article is a little helpful, I hope you can read it and repost, lovely.


[ Python drawing | 50 detailed examples in 7 categories to master python common visualization](http://mp.weixin.qq.com/s?__biz=MzA3MDQ1NDA4Mw==&mid=2247488133&idx=1&sn=7b5eb89d96166dd73ff8710696963566&chksm=9f3dcca9a349afec15cfabenec2315c23fenec21dc25f9f9adc15&chksm=9f3dcca9a49afec45bf9
[ Weather and meteorological data website collection, and the opening method of .nc data](http://mp.weixin.qq.com/s?__biz=MzA3MDQ1NDA4Mw==&mid=2247488133&idx=3&sn=ea45b509bf31ae033269fe87decc8a6c&chksm43b194d2reccam35scene=3&sn=ea45b509bf31ae033b1943d2rec8a6c&chksm=0639037d

[ Some suggestions for graduate study and selection of tutors for meteorological majors](http://mp.weixin.qq.com/s?__biz=MzA3MDQ1NDA4Mw==&mid=2247488147&idx=1&sn=6a08a078587e34e156174a226ea7d783&chksm=9f3dccbfa84a45a9a5a696d345sceneredirective#9f3dccbfa84a45a45a9f3dccbdqn=9f3dccbfas
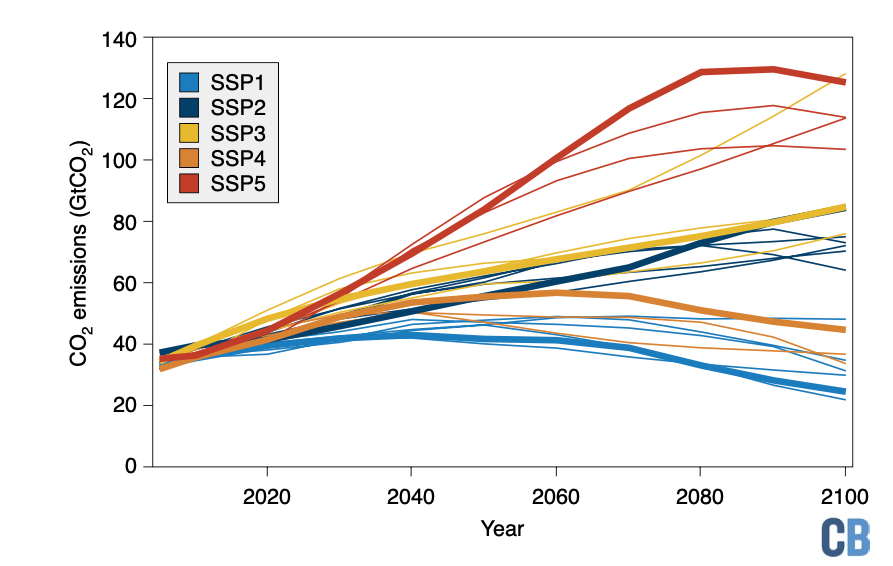
[ Are the future climate change scenarios predicted by the model reliable? ](http://mp.weixin.qq.com/s?__biz=MzA3MDQ1NDA4Mw==&mid=2247487361&idx=1&sn=4345383e902bfe873b968ac04870fce6&chksm=9f3dd1ada84a58bb77582fe601453e7d02e87e5092904d0adcha4d0adcha4d0adc
Recommended Posts