Pythonの基本的な描画チュートリアル(1)

科学研究者として、どのように画像をより良く描くかは常に編集者の関心事でした。特に紙を書くときは、美しく、よくできた、背の高い絵が目に見えない形で紙に追加されます。夢はトップ号の翼に当たる。このエディションでは、Pythonを使用して画像を描画する方法を説明します。
Pythonは、強力な視覚化機能を備えた使い慣れたプログラミング言語です。より一般的に使用される視覚化ライブラリは、主にmatplotlib( https:// matplotlib.org /)とseaborn( http://seaborn.pydata)です。 org / )、geoplotlib( https:// residentmario.github.io / geoplot / index.html)など。これらのライブラリには、誰もが学ぶことができる公式のチュートリアルとサンプルが用意されています。興味のある読者はクリックして開くことができます。上記のリンクは、自分で新しいスキルのロックを解除します。ここでの編集者は、主に地球科学の分野で一般的に使用されるいくつかの画像タイプを紹介します。
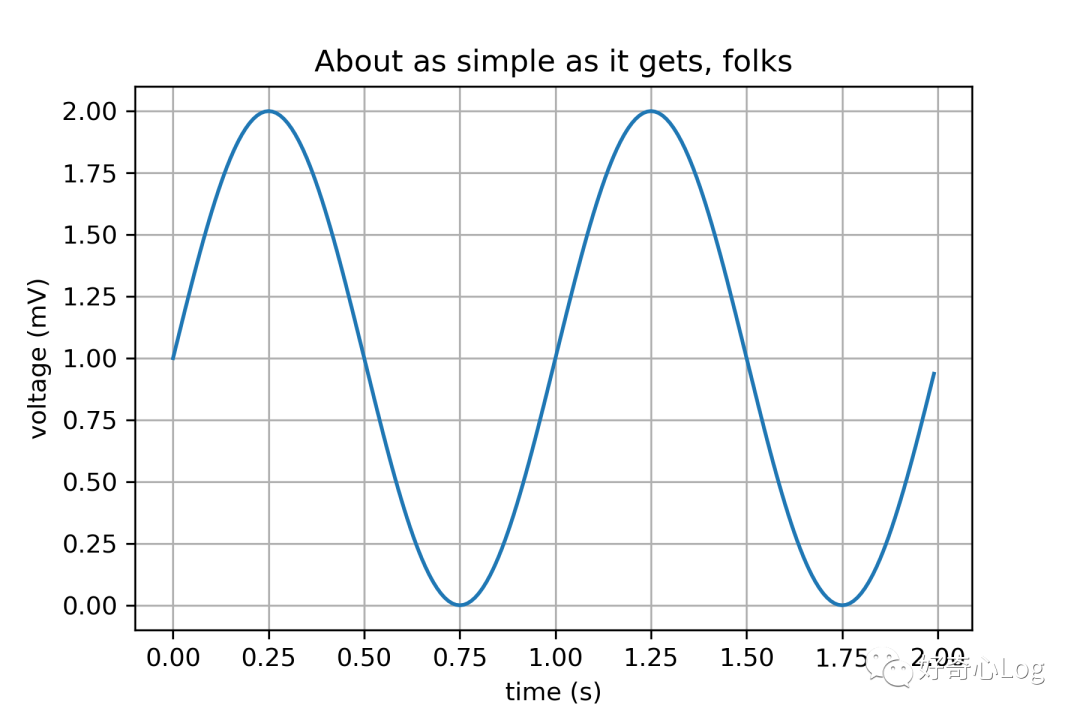
1 折れ線グラフ ##

import matplotlib
import matplotlib.pyplot as plt
import numpy as np

# Data for plotting
t = np.arange(0.0,2.0,0.01)
s =1+ np.sin(2* np.pi * t)

fig, ax = plt.subplots()
ax.plot(t, s)

ax.set(xlabel='time (s)', ylabel='voltage (mV)',
  title='About as simple as it gets, folks')
ax.grid()
plt.show()
2 ヒストグラム/確率分布グラフ
import matplotlib
import numpy as np
import matplotlib.pyplot as plt

np.random.seed(19680801)

# example data
mu =100  # mean of distribution
sigma =15  # standard deviation of distribution
x = mu + sigma * np.random.randn(437)

num_bins =50

fig, ax = plt.subplots()

# the histogram of the data
n, bins, patches = ax.hist(x, num_bins, density=1)

# add a 'best fit' line
y =((1/(np.sqrt(2* np.pi)* sigma))*
  np.exp(-0.5*(1/ sigma *(bins - mu))**2))
ax.plot(bins, y,'--')
ax.set_xlabel('Smarts')
ax.set_ylabel('Probability density')
ax.set_title(r'Histogram: $\mu=100$, $\sigma=15$')

# Tweak spacing to prevent clipping of ylabel
fig.tight_layout()
plt.show()
3 カラーリングマップ/ヒートマップ
import numpy as np
import matplotlib
import matplotlib.pyplot as plt
# sphinx_gallery_thumbnail_number =2

leadtime =["lead 1 mon","lead 2 mon","lead 3 mon","lead 4 mon","lead 5 mon","lead 6 mon"]
param =["Temperature","Wind","Precipitation","SLP","Humidity","Heat flux"]

coef = np.array([[0.95,0.9,0.85,0.8,0.82,0.7],[0.93,0.86,0.82,0.78,0.8,0.65],[0.88,0.82,0.8,0.72,0.75,0.62],[0.85,0.78,0.75,0.68,0.7,0.56],[0.8,0.72,0.7,0.65,0.68,0.5],[0.78,0.68,0.65,0.6,0.6,0.45],])

fig, ax = plt.subplots()

im, cbar =heatmap(coef, leadtime, param, ax=ax,
     cmap="PiYG", cbarlabel="Correlation Coefficient")
texts =annotate_heatmap(im, valfmt="{x:.2f}")

fig.tight_layout()
plt.show()
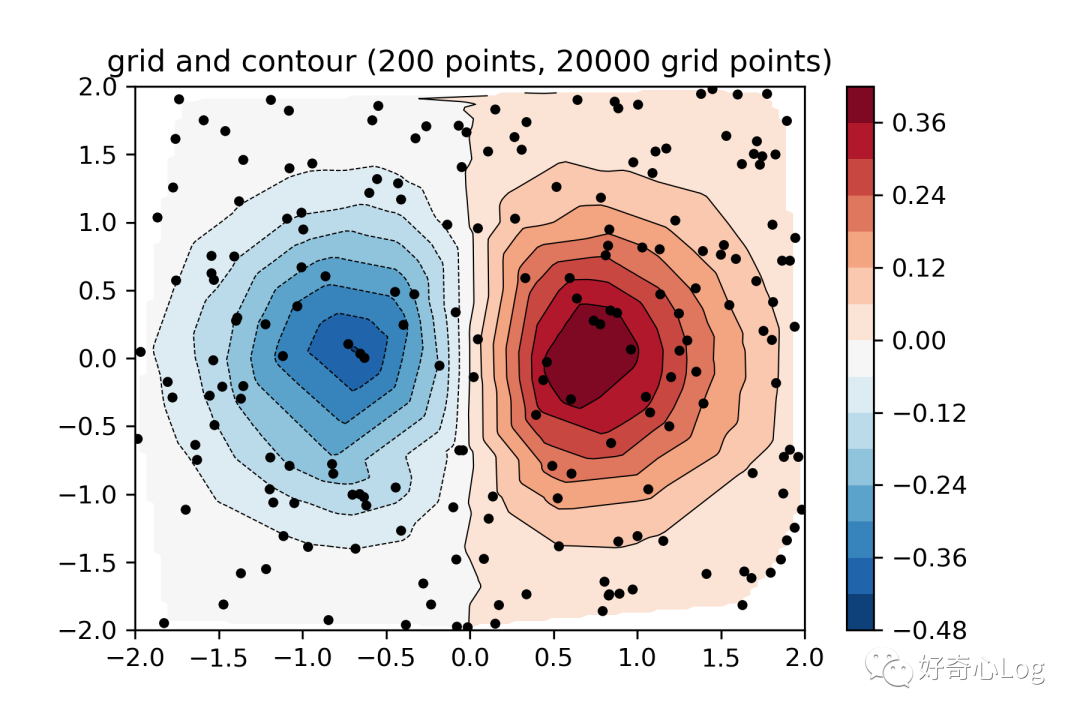
4 ポイントマップと輪郭マップ

import matplotlib.pyplot as plt
import matplotlib.tri as tri
import numpy as np

np.random.seed(19680801)
npts =200
ngridx =100
ngridy =200
x = np.random.uniform(-2,2, npts)
y = np.random.uniform(-2,2, npts)
z = x * np.exp(-x**2- y**2)

fig, ax1 = plt.subplots()
# -----------------------
# Interpolation on a grid
# -----------------------
# A contour plot of irregularly spaced data coordinates
# via interpolation on a grid.
# Create grid values first.
xi = np.linspace(-2.1,2.1, ngridx)
yi = np.linspace(-2.1,2.1, ngridy)

# Linearly interpolate the data(x, y)
# on a grid defined by(xi, yi).
triang = tri.Triangulation(x, y)
interpolator = tri.LinearTriInterpolator(triang, z)
Xi, Yi = np.meshgrid(xi, yi)
zi =interpolator(Xi, Yi)

# Note that scipy.interpolate provides means to
# interpolate data on a grid as well. The following
# would be an alternative to the four lines above:
# from scipy.interpolate import griddata
ax1.contour(xi, yi, zi, levels=14, linewidths=0.5, colors='k')
cntr1 = ax1.contourf(xi, yi, zi, levels=14, cmap="RdBu_r")
fig.colorbar(cntr1, ax=ax1)
ax1.plot(x, y,'ko', ms=3)
ax1.set(xlim=(-2,2), ylim=(-2,2))
ax1.set_title('grid and contour (%d points, %d grid points)'%(npts, ngridx * ngridy))
plt.show()
これでこの号の紹介は終わりです。記事のコードは水平方向にスワイプできます。実際の操作に便利なように、関連するコードとサンプルはBaiduネットワークディスクに保存されています。リンク:https://pan.baidu.com/s/1uSGDqbeCAh1ZS -dz-zs5tA抽出コード:8n9x、読者や友人はダウンロードして学ぶことができます。
参照リンク
https://matplotlib.org/gallery/index.html
最後に、編集者は、Python、NCL、Matlabなどはすべて一般的に使用されるデータ処理および描画ソフトウェアであり、それぞれに独自の利点と特性があると言いたいです。もちろん、ツールは多くはありませんが、洗練されています。自分に合ったツールを見つけて、それらを上手にマスターしてください。最も重要な。
Recommended Posts