Nagios3 in ubuntu serve
Foreword: I want to monitor whether Mysql under ubuntu server 8.04 is running normally, so I found Nagios, Cacti and cactiez, cacti has strong drawing ability, nagios3 has strong alarm ability; after a simple trial, I think the configuration of cacti is not Nagios The configuration is simple, so try nagios first. The version used is 3.2.0
Experimental environment: install nagios3 on the ubserver5 machine, and monitor the www and mysql services on the ubserver3 and ubserver4 machines.
IP of ubserver5: 192.168.3.50
IP of ubserver3: 192.168.3.30
IP of ubserver4: 192.168.3.40
operating:
- Install nagios3 on ubserver5 and configure it. Because web service is needed, apache2 must be installed first. Just one command.
sudo apt-get install apache2
(1) Installation, only one command is needed to install the plug-ins, cgi, postfix, etc. required by nagios3.
sudo apt-get install nagios3
/etc/nagios-plugins is the plug-in required by nagios3
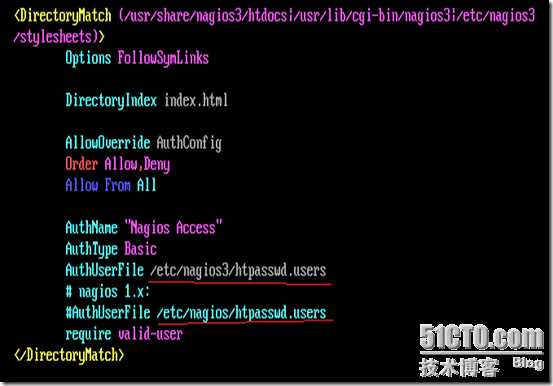
/etc/apache2/conf.d/nagios3.conf set the nagios3 authentication file in /etc/nagios3/htpasswd.users
/etc/nagios3/extinfo_nagios2.cfg set the extended information of the host and service to be monitored, such as the icon of the host
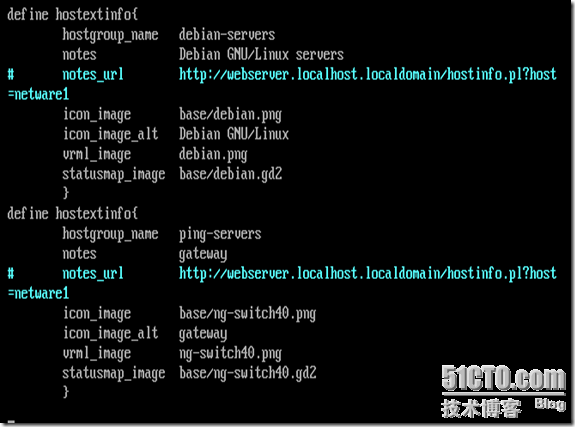
/usr/share/nagios/htdocs/p_w_picpaths/logos is the icon to be used. If you can't see the icon in the monitoring interface, you must modify the file etc/nagios3/extinfo_nagios2.cfg
By default, after the installation, there are the following configuration files in the /etc/nagios3/conf.d directory:
contacts_nagios2.cfg defines contacts
extinfo_nagios2.cfg To monitor the extended information of the host and service
generic-host_nagios2.cfg host definition template
generic-service_nagios2.cfg service definition template
host-gateway_nagios2.cfg The default gateway definition to be monitored
hostgroups_nagios2.cfg groups the hosts to be monitored
The definition of localhost_nagios2.cfg native monitoring
services_nagios2.cfg To monitor the services on the host
timeperiods_nagios2.cfg defines the time period for monitoring and notification
All configurations can be placed in one file, like localhost_nagios2.cfg (monitoring this machine), the definition of the host and service are written in one file, but for the convenience of future management and clear organization, it is better to separate the configuration files. You can use localhost_nagios2.cfg as a template to create the host to be monitored. This depends on personal preference. All *.cfg files in /etc/nagios3/conf.d will be read by nagios3, so you can create your own configuration files as needed.
/etc/nagios3/nagios.cfg is the main configuration file of nagios3
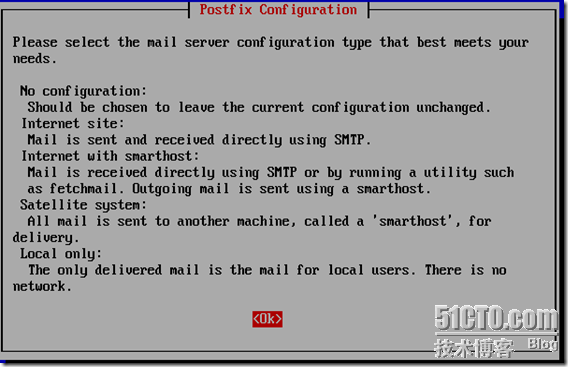
(2) Postfix configuration, used to send email to the administrator, there are three options: no configuration, internet site, internet with smarthost, satellite system, local only, here I choose internet site.
(3) Set the nagiosadmin password. If you don't set it here, you need to create it with htpasswd -C /etc/nagios3/htpasswd.users nagiosadmin after installation, so you must set the password here.
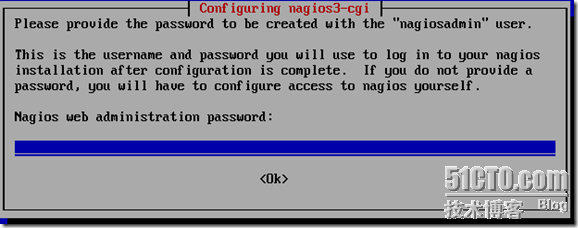
The installation is now complete. Only need to configure postfix, set the nagiosadmin password.
(4) Create the host file hosts.cfg to be monitored in the /etc/nagios3/conf.d directory
sudo vim /etc/nagios3/conf.d/hosts.cfg
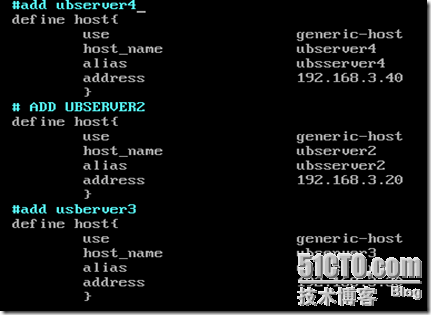
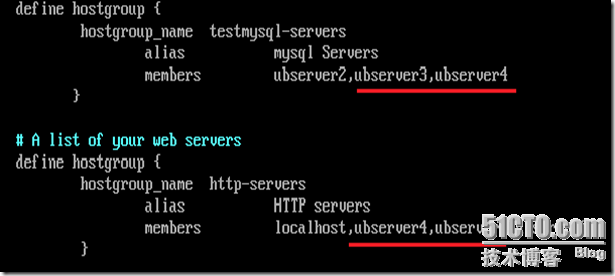
(5) Modify the hostgroups_nagios2.cfg file in the /etc/nagios3/conf.d directory, add a host group, and add the following content:
(6) Modify the services_nagios2.cfg file in the /etc/nagios3/conf.d directory to add a new service for detecting mysql, and the service for detecting http is available by default.
Check the mysql service, here is used to check the port 3306, 3306 is the default port of mysql, modify it according to the actual use.

Check the www service, here is used to check the port 80, 80 is the default port of wwwl, modify it according to the actual use.

The value of hostgroup_name here must be the same as the value of hostgroup_name set in hostgroups_nagios2.cfg, otherwise an error occurs.
(7) Restart the nagios3 service and test
cd /etc/nagios3
sudo nagios3 –v nagios.cfg

No error occurred
sudo /etc/init.d/nagios3 restart
Enter the nagiosadmin password with http://192.168.3.50/nagios3 to enter the nagios monitoring screen.


Summary: Before configuration, plan the hosts to be monitored (hosts.cfg), divide them into groups (hostgroups_nagios2.cfg), and define the services to be monitored (services_nagios2.cfg); you must know whether there are plug-ins required for monitoring services Is it installed in /etc/nagios-plugins, what check_command to use and how to use it. The advantage of grouping hosts according to the service to be monitored is that you can add the host to be monitored for the service later, just add it to the group. The configuration of nagios3 is relatively easy, and it is not more difficult than expected. If you want nagios to display performance graphs like cacti, you can try the pnp4nagios plugin, nagiosgrapher software.
Recommended Posts