Python basic drawing tutorial (two)

This issue is the second issue of python basic drawing. Recently, the editor learned several graphics drawing under the push of the instructor, and I hurried to share it with you.
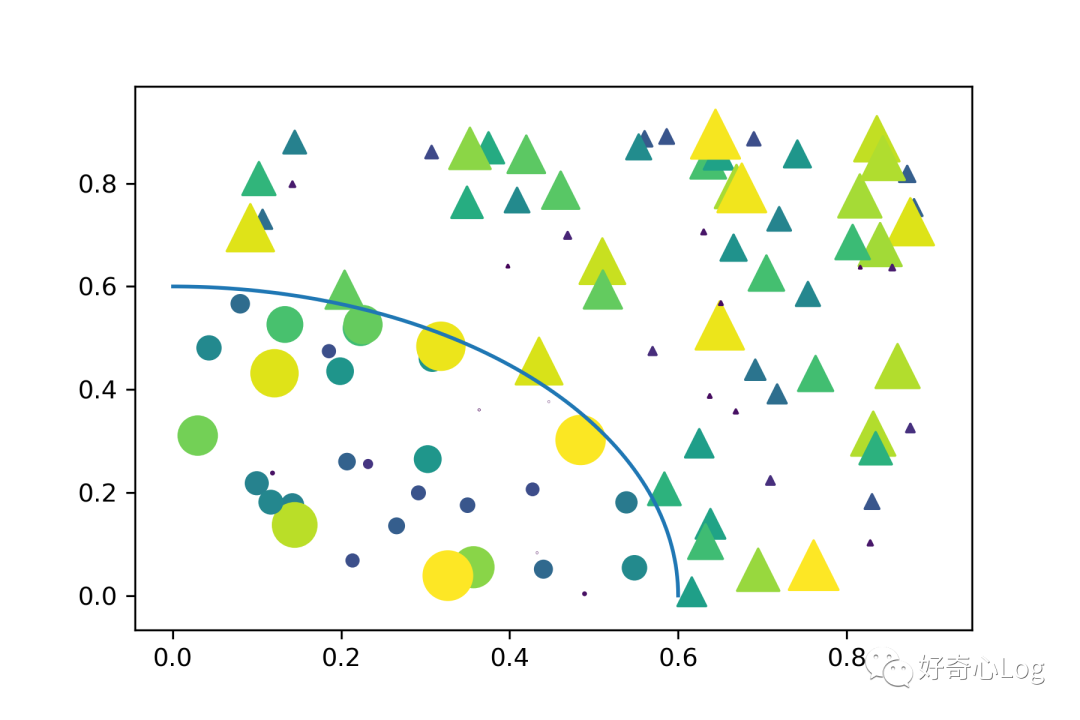
1. Scatter chart
import matplotlib.pyplot as plt
import numpy as np

# Fixing random state for reproducibility
np.random.seed(19680801)
fig = plt.figure()

N =100
r0 =0.6
x =0.9* np.random.rand(N)
y =0.9* np.random.rand(N)
area =(20* np.random.rand(N))**2  # 0 to 10 point radii
c = np.sqrt(area)
r = np.sqrt(x **2+ y **2)
area1 = np.ma.masked_where(r < r0, area)
area2 = np.ma.masked_where(r >= r0, area)
plt.scatter(x, y, s=area1, marker='^', c=c)
plt.scatter(x, y, s=area2, marker='o', c=c)
# Show the boundary between the regions:
theta = np.arange(0, np.pi /2,0.01)
plt.plot(r0 * np.cos(theta), r0 * np.sin(theta))
plt.show()
2. Pie Chart
fig, ax = plt.subplots(figsize=(6,3), subplot_kw=dict(aspect="equal"))

recipe =["SST","SLP","UWND","VWND","HFLUX","PRECIPITATION"]

data =[0.34,0.16,0.22,0.05,0.08,0.15]

wedges, texts = ax.pie(data, wedgeprops=dict(width=0.5), startangle=-40)

bbox_props =dict(boxstyle="square,pad=0.3", fc="w", ec="k", lw=0.72)
kw =dict(arrowprops=dict(arrowstyle="-"),
   bbox=bbox_props, zorder=0, va="center")for i, p inenumerate(wedges):
 ang =(p.theta2 - p.theta1)/2.+ p.theta1
 y = np.sin(np.deg2rad(ang))
 x = np.cos(np.deg2rad(ang))
 horizontalalignment ={-1:"right",1:"left"}[int(np.sign(x))]
 connectionstyle ="angle,angleA=0,angleB={}".format(ang)
 kw["arrowprops"].update({"connectionstyle": connectionstyle})
 ax.annotate(recipe[i], xy=(x, y), xytext=(1.35*np.sign(x),1.4*y),horizontalalignment=horizontalalignment,**kw)

ax.set_title("Weight proportion")
plt.show()
3. Wind field vector diagram
import matplotlib.pyplot as plt
import numpy as np

x = np.linspace(-5,5,5)
X, Y = np.meshgrid(x, x)
U, V =12* X,12* Y

data =[(-1.5,.5,-6,-6),(1,-1,-46,46),(-3,-1,11,-11),(1,1.5,80,80),(0.5,0.25,25,15),(-1.5,-0.5,-5,40)]

data = np.array(data, dtype=[('x', np.float32),('y', np.float32),('u', np.float32),('v', np.float32)])

fig1, axs1 = plt.subplots(nrows=2, ncols=2)
# Default parameters, uniform grid
axs1[0,0].barbs(X, Y, U, V)

# Arbitrary setof vectors, make them longer and change the pivot point
# ( point around which they're rotated) to be the middle
axs1[0,1].barbs(
 data['x'], data['y'], data['u'], data['v'], length=8, pivot='middle')

# Showing colormapping with uniform grid.  Fill the circle for an empty barb,
# don't round the values, and change some of the size parameters
axs1[1,0].barbs(
 X, Y, U, V, np.sqrt(U **2+ V **2), fill_empty=True, rounding=False,
 sizes=dict(emptybarb=0.25, spacing=0.2, height=0.3))

# Change colors as well as the increments for parts of the barbs
axs1[1,1].barbs(data['x'], data['y'], data['u'], data['v'], flagcolor='r',
     barbcolor=['b','g'], flip_barb=True,
     barb_increments=dict(half=10, full=20, flag=100))

# Masked arrays are also supported
masked_u = np.ma.masked_array(data['u'])
masked_u[4]=1000  # Bad value that should not be plotted when masked
masked_u[4]= np.ma.masked
fig1.savefig("/Users/chenyue/Downloads/f7.png",dpi=300)
plt.show()
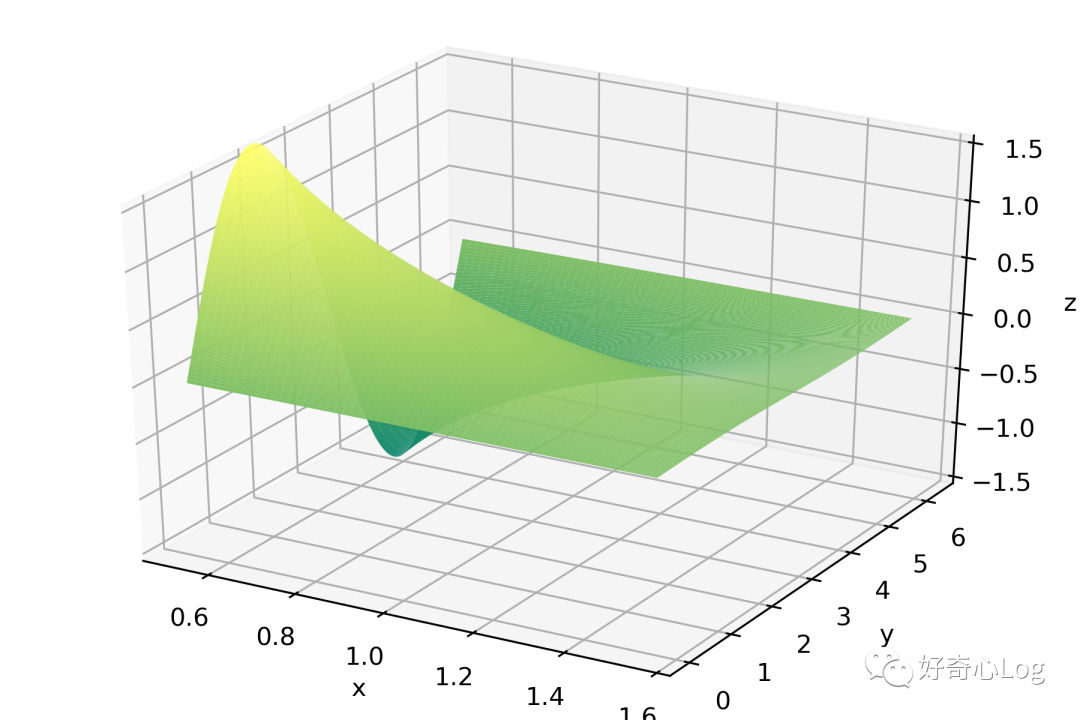
4. 3 D picture
import numpy as np
import matplotlib.pyplot as plt
from matplotlib import cm
from mpl_toolkits.mplot3d import Axes3D

X = np.arange(30*np.pi/180,89*np.pi/180, np.pi/180)
Y = np.arange(0,360*np.pi/180, np.pi/180)
X, Y = np.meshgrid(X, Y)
Z = np.sin(Y)/np.tan(X)

fig = plt.figure()
ax =Axes3D(fig)
ax.plot_surface(X, Y, Z, rstride=1, cstride=1, cmap='summer')
ax.set_xlabel('x')
ax.set_ylabel('y')
ax.set_zlabel('z')
ax.set_zlim(-1.5,1.5)
plt.show()
This is the end of the introduction of this issue. The code in the article can be swiped horizontally. For the convenience of practical operation, the relevant code and samples have been stored in the Baidu network disk, link: https://pan.baidu.com/s/1uSGDqbeCAh1ZS -dz-zs5tA Extraction code: 8n9x, readers and friends can go to download and learn.
Reference link
https://matplotlib.org/gallery/index.html
I hope that this issue of the editor will help readers and friends, and remember to practice more.
Recommended Posts