Python3 external module use
[ TOC]
0 x00 Quick Start####
(1) List of external modules
Description: The Python external module can be said to be the existence of the power of Python, which makes the Python language highly extensible, with many methods of use and very simple to use, which is especially important in our daily operation and maintenance development and learning;
#>>> dir(random)  #View and use functions in the module,Prerequisites must introduce modules,High-level usage import introduces modules as module aliases;
#>>> help(random) #Module help
import urllib    #Website request module
import lxml      #xpath parsing library module from lxml import etree

# Form Excel processing
import cvs       #cvs form module
import xlwt      #excel form module
import xlsxwriter #excel file module

# Introduced in other articles
import psutil    #System performance information module
import exifread   #Picture exif information module
import ruamel.yaml #YAML parsing module
import dnspython   #DNS resolution information module
import pycurl      #web detection module
0 x01 Detailed Explanation of External Module####
urllib module#####
urllib is a package, there are 4 modules below, mainly for web page requests;
Document address
urllib.request is used to open and read url
urllib.error contains exceptions caused by urllib.request (URLERROR (request exception) -> HTTPERROR (webpage response code exception 300~599))
urllib.parse parses url
urllib.robotparser is used to parse robots.txt files
Case:
# grammar
urllib.request.Request(url, data=None, headers={}, origin_req_host=None, unverifiable=False, method=None)  #Return the object of the request configuration request
urllib.request.urlopen(url, data=None,[timeout,]*, cafile=None, capath=None, cadefault=False, context=None) #Make a website request

urllib.request.ProxyHandler(proxies=None)  #Set the proxy address to create the Proxyhandler parameter is a dictionary{'Types of':'Proxy IP:port'}Return handler
urllib.request.build_opener([handler,...])  #Create Opener binding proxy resources,Return to install opener open tool object
urllib.request.install_opener(opener)         #Install Opener

# POST requestThe data argument must be a bytes object in standard application/x-www-form-urlencoded format;
urllib.parse.urlencode(data, doseq=False, safe='', encoding=None, errors=None, quote_via=quote_plus)

urllib.parse.quote("cyber security")  #Parse Chinese URL

# Case
import urllib.request
import urllib.error

url ="http://weiyigeek.github.io"

data ={'action':'postValue'} #Set post request parameters
data = urllib.parse.urlencode(data).encode('utf-8')  #Equivalent to: application/x-www-form-urlencoded; charset=UTF-8

req = urllib.request.Request(url, data)
req.add_header('User-Agent','Mozilla/5.0 (Windows NT 10.0; Win64; x64; rv:66.0) Gecko/20100101 Firefox/66.0') #Set request header

#-----------------------------------------------------#
try:
  res = urllib.request.urlopen("https://weiyigeek.github.io",context=ssl._create_unverified_context())  #Support SSL request
  print("Request URL:\n",res.geturl())print("status code:",res.getcode())print("Return message header:\n",res.info())print("Request header information:",req.headers)   #Note that this is Request()Object returned by class method
except HTTPError as e:  #[Note] HTTPError must be above URLError
  print("Server response error:",e.code)print("Print out the specific error page",e.read().encode('utf-8'))
except URLError as e: #Contains HTTPError
  print("Server link failed:",e.reason)else:print("The request is successful!")

############ Results of the########################
# Request URL:http://weiyigeek.github.io
# Status code: 200
# Return message header:
# Server: nginx/1.15.9
# Date: Fri,12 Apr 201910:57:51 GMT
# Content-Type: text/html; charset=utf-8
# Content-Length:15278
# Last-Modified: Wed,10 Apr 201901:12:59 GMT
# Connection: close
# ETag:"5cad431b-3bae"
# Accept-Ranges: bytes

# Request header information:{'User-Agent','Mozilla/5.0 (Windows NT 10.0; Win64; x64; rv:66.0) Gecko/20100101 Firefox/66.0'}
lxml module#####
To use xpath, you must first download the lxml library, xpath is just an element selector in another library lxml of python;
Reference: https://cuiqingcai.com/2621.html
# Use pip to download the lxml library
pip install lxml
from lxml import etree
## Omit some codes, dom_tree is the etree object we parsed,
dom_tree = etree.HTML(html)
## Sentence one:
dom_tree.xpath('/html/body/div/a/@href')
## Statement two:
dom_tree.xpath('//div/a/@href')
## Statement two:
dom_tree.xpath('//div[@class="info-co"]/a/@href')Use the class attribute
dom_tree.xpath('//div/a/@href') #Will return all link URLs
dom_tree.xpath('//div/a/text()') #Will get the names of all links
actual case:
# Get the html of the request website
dom_tree = etree.HTML(html)
links = dom_tree.xpath("//div/span[@class='info-col row2-text']/a") #Return an xpath object

for i in links:print(i.text)for index inrange(len(links_yaoshi)):print(index)print(links[index].text)print(links_yaoshi[index].text)print(links_danjia[index].text)

# Be sure to note that the xpath search and extraction results can be used "|"To extract multiple results, so the final code is as follows:
data = dom_tree.xpath("//div[@class='info-table']/li")
info = data[0].xpath('string(.)').extract()[0]print(data[0].xpath('string(.)').strip())  #Just print the result of the first line

# worth learning
dataRes = dom_tree.xpath("//div/span[@class='info-col row2-text']/a | //div/span[@class='c-prop-tag2'] | //span[@class='info-col price-item minor']")
0 x02 Form data processing####
csv module#####
(1) csv.reader: read the csv file and return the iteration type
(2) csv.writer(IO, dialect, delimiter): set the template for writing the csv file
(3) DictReader: also reads the CSV file and returns the dictionary type
(4) DictWriter: write dictionary to CSV file
(5) writerow: insert a row of data into the csv file, put each item in the list below into a cell
Case:
#! /usr/bin/python3
# Python3 uses the csv module to read and write csv files

import csv

# Case 1: Write output data to CSV file
data =[("Mike","male",24),("Lee","male",26),("Joy","female",22)]
data1 =[[x]for x inrange(10)if x %2==0]
data2 =['test','w','I am chinese']  #Between characters,segmentation

# Open the file and set the mode to open with with, you don’t need to specifically close the file
# Python3.4, the new way to solve the blank line problem
withopen('demo.csv','w+',newline='',encoding='utf-8')as csvfile:
 # dialect is the way to open the csv file, the default is excel, delimiter="\t"The parameter refers to the separator when writing
 csvwriter = csv.writer(csvfile,dialect=("excel"),delimiter=',')for each in data:print(">>>",each)
  csvwriter.writerow(each)

 csvwriter.writerow(data2) #Write in one line

 # Insert a row of data into the csv file, put each item in the list below into a cell (you can use a loop to insert multiple rows)
  csvwriter.writerow(["A","B","C","D"])

# Case 2: Open csv file to read data
withopen('demo.csv','r+',encoding='utf-8')as f:
 res = csv.reader(f)for x in res:print(x[0])

# There are three columns of data in the csv, and the three variables are used for traversal reading.
for title, year, director in reader:
 list.append(year)print(title,"; ",  year ,"; ",  director)withopen("test.csv","r", encoding ="utf-8")as f:
 reader = csv.DictReader(f)  #Read dictionary object
 column =[row for row in reader]>python demo6.1.py
>>>(' Mike','male',24)>>>('Lee','male',26)>>>('Joy','female',22)
Mike
Lee
Joy
test
xlwt module#####
Description: For execl table data reading, writing, inserting, deleting, etc., it supports a wealth of calculation functions and charts;
Download from official website: http://pypi.python.org/pypi/xlwt
Basic method:
xlwt.Workbook(encoding ='Encoding format')
workbook.add_sheet('Table name')
worksheet.write(0,0,"Write data")
workbook.save('Storage file name')
actual case:
#! /usr/bin/env python
# - *- coding: utf-8-*-import xlwt
def main():
 workbook = xlwt.Workbook(encoding='utf-8')  #Create workbook
 worksheet = workbook.add_sheet('sheet name')  #Create workbook

 # Insert from 0
 worksheet.write(0,0,'Hello')  # write_string()
 worksheet.write(1,0,'World')  # write_string()
 worksheet.write(2,0,2)  # write_number()
 worksheet.write(3,0,3.00001)  # write_number()
 worksheet.write(4,0,'=SIN(PI()/4)')  # write_formula()
 worksheet.write(5,0,'')  # write_blank()
 worksheet.write(6,0, None)  # write_blank()

 linenum =7
 # Use a two-dimensional array to determine the main,Write content to the cell
 worksheet.write(linenum,0,"ID")
 worksheet.write(linenum,1,"Root domain")
 worksheet.write(linenum,2,"Bind mailbox")
 worksheet.write(linenum,3,"DNS server 1")
 worksheet.write(linenum,4,"DNS server 2")
 worksheet.write(linenum,5,"status")

 # Save excel document
 workbook.save('Excel_Workbook.xls')print("Writing is complete!")if __name__ =='__main__':main()
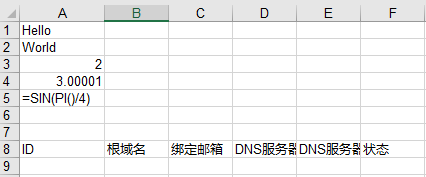
WeiyiGeek.excel form processing
xlsxwriter module#####
Description: Operate the xlsxwriterm module of EXCEL, which can operate text/number/formulas and charts of multiple worksheets;
Module features:
- Compatibility Exce file supports Excel2003/2007 and other versions, supports all Excel cell formats
- Cell merge/annotation/automatic filtering can be performed, rich multi-format strings, etc.
- Support grouping PNG/jpg images, custom charts
- Memory optimized mode supports writing large files
Module installation:
pip3 install xlsxwriter

# manual
1. Create excel file object
2. Create worksheet object
3. Create a chart object
4. Define the format object of excel
**Module method: **
#1. workbook class
obj=Class.Workbook(filename[,options])  #This class creates a Workbook object of XlsxWriter, options is dict type is optional parameter, generally used as the format of the initial worksheet content
worksheet=obj.dd_worksheet([sheetname])  #Method is used to add a new worksheet, sheetname is the name of the worksheet, the default is sheet1
format=obj.add_format([properties])  #Method is used to create a new format object in the worksheet to format the cell bold/normal
format.set_border(1) #Define format object cell border bold(1 pixel)Format
format.set_bg_color('#999999') #Define the background presentation of the object
format.set_blod()  #Show bold
format.set_num_format('0.00') #Define the format of the cell border to be bolded by 1 pixel;
format.set_align('center')

chart=obj.add_chart(options)  #Used to create a chart object in the worksheet, internally through insert_chart()Method to achieve, the parameter is dict type is to specify a dictionary attribute for the icon
obj.close()  #The role is to close the worksheet file
#2. Worksheet class:
# The Worksheet object cannot be instantiated directly, but call add through the Workbook object_worksheet()Method to create, representing an excel worksheet, which is a core class

worksheet.write(row, col,*args) #It is used to write ordinary data into the cell.
# To simplify the writing process of different data types, the write method has been used as an alias for other more specific data type methods
write_row('A1',Data written(Single character/Array),Format type)  #Write a line starting from A1
write_cloumn('A2',Data written(Single character/Array),Format type)  #Write a column starting from A2)write_string(): Write string type data
wirte_number(): Write digital data
write_blank(): Write empty type data
write_formula(): Write formula data
write_datetime(): Write date type data
wirte_boolean(): Write logical data
write_url(): Write hyperlink data

worksheet.set_row(row, height, cell_format, options) #Used to set the attributes of row cells.
# Options dictionary type, setting line hidden (hidden), level (combination classification), collpsed (folded)

worksheet.set_column(first_col, last_col, width, cell_format, options) #Used to set the properties of one or more columns of cells

worksheet.insert_image(row, col, image[, options]) #Used to insert the picture into the specified cell, support various formats such as PNG, JPEG, BMP and the specified picture location/proportion/Connection URL information.
#3. The chart type real chart component, which supports area, bar chart, column chart, line chart, scatter chart, etc.
# A chart object is added through Workbook_chart method is created by{type,'Chart Type'}Dictionary to define chart type
workbook.add_char({'type':"column"})
area: chart of area style
bar: bar graph
column: histogram
line: line style chart
pie: Pie chart
scatter: scatter chart
stock: stock-style chart
radar: radar style chart

# Insert into the specified position
chart.add_series(options) #The chart parameter options used to add a data series is a dictionary type, a dictionary used to set the chart series options
# Common methods:
categories: set the chart category label range;
values: set the chart data range;
line: Set chart line properties, including width, color, etc.;
name:"Reference as legend table-That is, the bar graph on the right"

# Other common methods show
chart.set_y_axis(options) #Set chart y-axis subtitle
chart.set_x_axis(options) #Set the chart X axis subtitle
# name: set the name of the x axis
# name_font: Set the x-axis font
# num_font: Set the x-axis digital font attributes;

chart.set_size(options)  #Set icon size{'width':'1024','height':768}
chart.set_title(options)#Set the title above the chart, the parameter options is a dictionary type, and the dictionary used to set the chart series options
chart.set_style(style_id)#Used to set the chart style, style_id is different numbers representing different styles
chart.set_table(options) #Set the x-axis to the data table format
worksheet.insert_chart(row,col,chartObj) #Insert the set chart into the workbook
Simple example
workbook = xlsxwriter.Workbook('Chart.xlsx')
worksheet =workbook.add_worksheet()
chart = workbook.add_chart({'type':'cloumn'})

format1 = workbook.add_format()
format1.set_border(1)

format2 = workbook.add_format()
format2.set_align('center')

worksheet.write_row('A1',Data written(Single character/Array),format1)  #Write a line starting from A1
worksheet.write_cloumn('A2',Data written(Single character/Array),format2)  #Write a column starting from A2)for i inrange(2,7)
 worksheet.write_formula('I'+i,'=AVERAGE(B'+i+':H'+i+')'.format1)  #From B2:Average of H2
 # The same is true for adding data to the chart (emphasis)
 chart.add_series({'categories':'=Sheet1!B1:H1', #Will be described as the chart below the x-axis column
  ' values':'=Sheet1!$B$'+i+':$H$'+1, #Chart data area assignment
  ' line':{'color':'black'},'name': u'Reference as legend table-That is, the bar graph on the right', #Default is series 1})

chart.set_x_axis({'name':u'Number of weeks'})
chart.set_y_axis({'name':u' Mb/s '})

worksheet.insert_chart('AB', chart)
workbook.close() #Close document
**Module example: **
#! /usr/bin/env python
# coding=utf-8import xlsxwriter

# Create a new Excel file and add worksheets
workbook = xlsxwriter.Workbook('demo.xlsx')     #Create workbook

# Create a new workbook
worksheet1 = workbook.add_worksheet()            #Create worksheet sheet1(Default table name)
worksheet2 = workbook.add_worksheet('testSheet2') #Create worksheet testsheet2

# Create a new format object in the worksheet to format the cells to achieve bold
bold = workbook.add_format({'bold': True})    #Way 1
bold = workbook.add_format();bold.set_bold()  #Way 2

# Data is written into the workbook,Note: The two methods are actually only aliases. A1 and(0,0)Way positioning
worksheet.write('A1','Hello')        #Write simple text to the summary table
worksheet.write_string(0,1,'World')  #Write simple text string type data to the total table

worksheet.write('A2',123.456)        #Write numeric data
worksheet.write_number(1,1,123456)    #Write according to coordinates

worksheet.write('A3', None)             #Write empty data type
worksheet.write_blank(2,1,'')       #Write empty data type

worksheet.write('A4','=SUM(A1:B2)')       #Write formula data
worksheet.write_formula(3,1,'=SIN(PI()/4)')

worksheet.write('A5', datetime.datetime.strftime('2019-08-09','y%-m%-d%'),workbook.add_format({'num_format':'yyyy-mm-dd'}))       #Write date type data
worksheet.write_datatime(4,1,datetime.datetime.strftime('2019-08-09','y%-m%-d%'),workbook.add_format({'num_format':'yyyy-mm-dd'}))

worksheet.write('A6', True)       #Write logical type data
worksheet.write_boolean(5,1, False)

worksheet.write('A7','http://baidu.com')         #Write hyperlink data type
worksheet.write_url(6,1,'http://www.python.org')

# Set one or more column cell attributes
worksheet1.set_column(0,1,10, bold)   #Set the width of cells A to B to 10 pixels thick
worksheet1.set_column('C:D',20)  #Set the width of cells C to D to 20 pixels
worksheet1.set_column('E:G', None, None,{'hidden':1}) #Hide cells E to G

# Set one or more rows of cell attributes
worksheet1.set_row(0,30,bold)   #Set all 1 line unit and 30 pixels height to define bold
worksheet1.set_row(1,30,workbook,add_format({'italic':True}))   #Set all 1 line units and 30 pixels height to define italics
worksheet1.set_row(6, None, None,{'hidden':1}) #Hide row 6

# Insert python in the second cell book-logo.The png picture hyperlink is http://python.org
worksheet2.insert_image('A1','python-logo.jpg',{'url':'http://python.org'})
worksheet2.insert_image('A3','python-logo.jpg')   #Insert picture

# Char chart example
chart = workbook.addchart({type,'column'}) #Create a column(Cylindrical)icon

# Add data to the chart
chart.add_series({'categories':'=testSheet2!$A$1:$A$5','values':'=testSheet2!$B$1:$B3','line':{'color':'red'},'name':
})

# Set chart X axis display
chart.set_x_axis({'name':'x name','name_font':{'size':14,'bold': True}'num_font':{'italic': True}})

# Set the x-axis to the data table format
chart.set_table()

# Chart size
chart.set_size({'width':720,'height':576})
# Chart title
chart.set_title({'name':"Table Title Demo"})

# Chart style
chart.set_style(37)

# Insert chart into workbook
worksheet2.insert_chart('A7', chart)

workbook.close()    #Close workbook
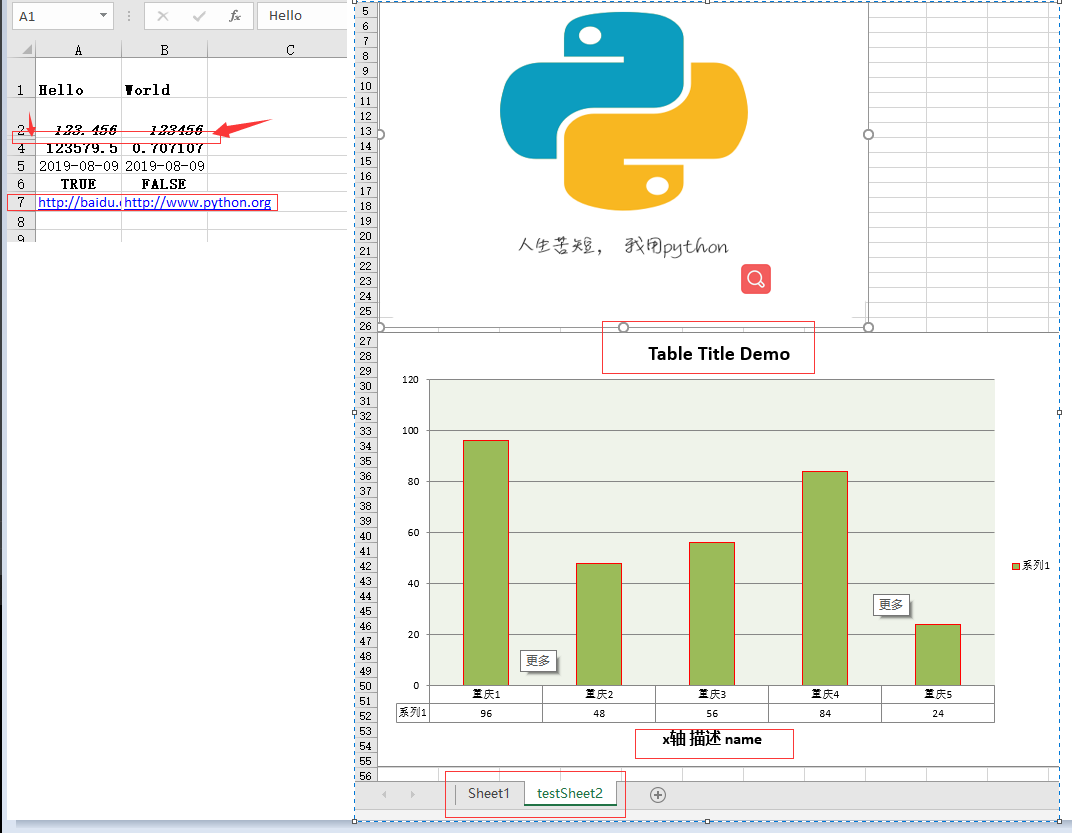
WeiyiGeek.
0 x04 file conversion
1. PDFMiner module#####
PDFMiner is a tool that focuses on extracting and analyzing text information from PDF documents. It can not only obtain information at a specific location on a specific page number, but also information such as fonts.
Installation module instructions:
# First install PDFMiner, pay attention to Python3 to install pdfminer3k
# Install pdfminer3k under Windows
pip install pdfminer3k

# Install pdfminer under Linux
pip install pdfminer
Working principle diagram:
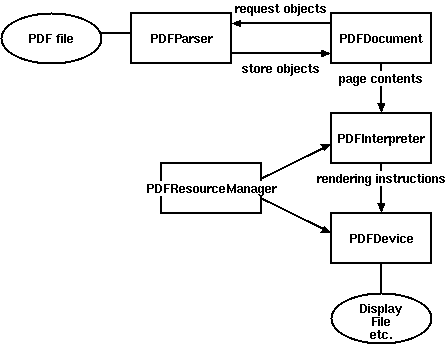
WeiyiGeek.
Classes used to parse pdf files:
- PDFParser: Get data from a file
- PDFDocument: save the acquired data, and PDFParser are interrelated
- PDFPageInterpreter: Process page content
- PDFDevice: translate it into the format you need
- PDFResourceManager: Used to store shared resources, such as fonts or images.
Layout analysis returns the LTPage object of each page in the PDF document. This object and the child objects contained in the page form a tree structure.
as the picture shows:
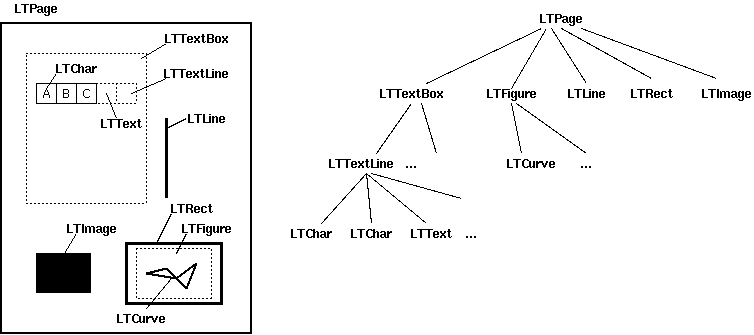
LTPage: Indicates that the entire page may contain LTTextBox, LTFigure, LTImage, LTRect, LTCurve and LTLine sub-objects.
- LTTextBox: Indicates that a group of text blocks may be contained in a rectangular area. Note that this box is created by geometric analysis and does not necessarily represent a logical boundary of the text. It contains a list of LTTextLine objects. Use the get_text() method to return the text content.
- LTTextLine: Contains a list of LTChar objects that represent a single text line. Character alignment is either horizontal or vertical, depending on the writing mode of the text. Use the get_text() method to return the text content.
- LTAnno: Letters in the text are actually represented as Unicode strings. It should be noted that although an LTChar object has actual boundaries, LTAno objects do not, because these are "virtual" characters, which are inserted after layout analysis based on the relationship between two characters (for example, a space).
- LTImage: Represents an image object. Embedded images can be in JPEG or other formats, but currently PDFMiner doesn't put much effort into graphic objects.
- LTLine: Represents a straight line. Can be used to separate text or drawings.
- LTRect: Represents a rectangle. Another picture or number that can be used for the frame.
- LTCurve: Represents a general Bezier curve
Recommended Posts