Centos system process management
1、 What is a process
A process is a running instance of an executable program that has been started. The process has the following components:
**1.1****The address space of allocated memory; **
1.2****Security attributes, including ownership credentials and privileges;
1.3****One or more threads of execution of the program code;
1.4****Process status
**Program: ** Binary files, static /bin/date, /usr/sbin/httpd, /usr/sbin/sshd, /usr/local/nginx/sbin/nginx.
**Process: ** is the process of program running, dynamic, with life cycle and running status.
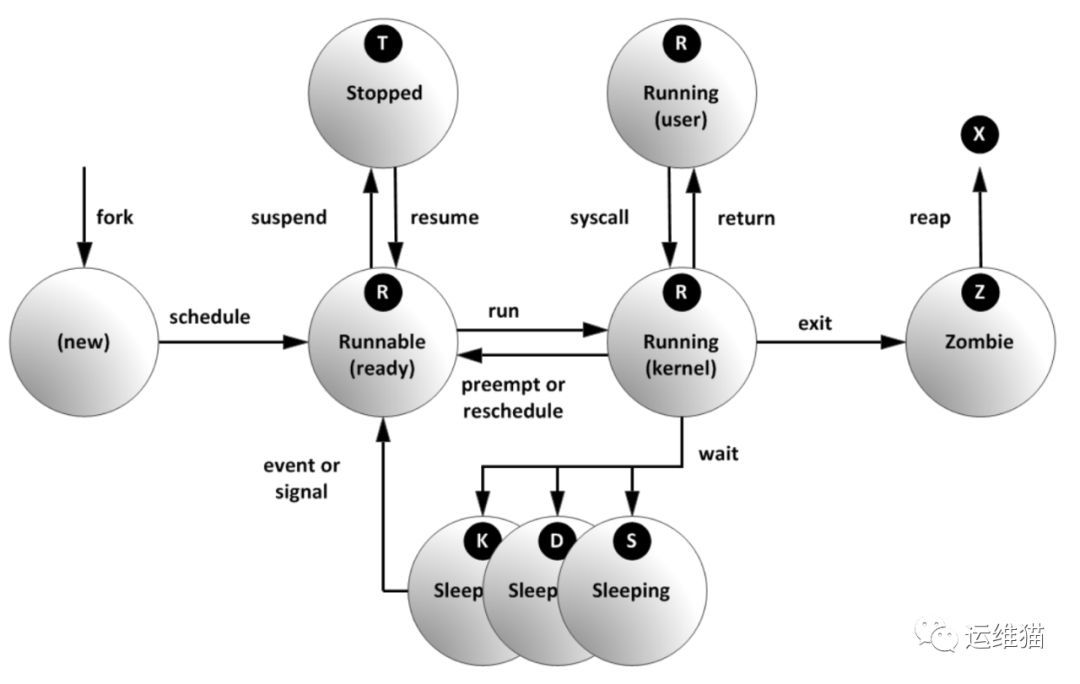
2、 The life cycle of the process
Described as follows:
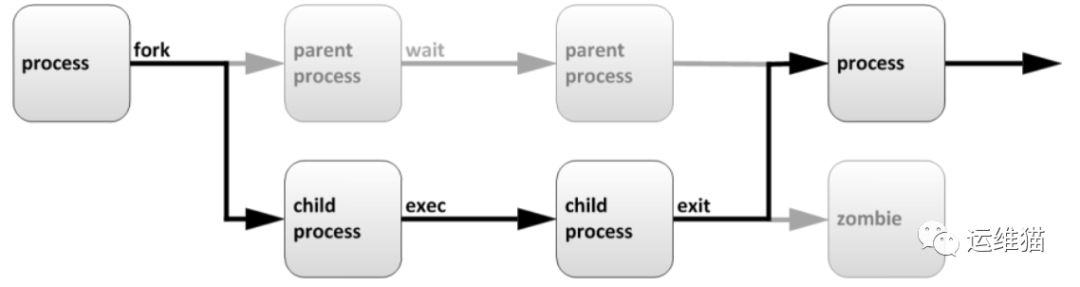
The parent process copies its own address space (fork [fɔ:k] fork) to create a new (child) process structure. Each new process is assigned a unique process ID (PID) to meet the needs of tracking security. PID and parent process ID (PPID) are elements of the child process environment. Any process can create a child process, and all processes are descendants of the first system process.
**The process with PID 1 in centos5 or 6 is: **init
**The process with PID 1 in centos7 is: **systemd
**Zombie process: **A process uses fork to create a child process. If the child process exits and the parent process does not call wait or waitpid to obtain the status information of the child process, the process descriptor of the child process is still stored in the system. This kind of process is called a zombie process.
**Express ** in your own words: the parent process exits, and the child process does not exit, then these child processes are not managed by the parent process, and become zombie processes.
3、 Process attributes
**Process ID (PID): ** is a unique value used to distinguish processes
ID of the parent process (PPID)
The user ID (UID) and the group to which the process belongs (GID)
**Process status: **The status is divided into running R, sleeping S, zombie Z
Priority of process execution
The name of the terminal to which the process is connected
**Process resource occupation: ** such as the size of the resource occupied (memory, CPU usage)
4、 Use ps to view process tool
**4.1 : Commonly used parameters: **
**a:**Display all processes associated with the current terminal
**u:****Display based on user format (**U: Display all processes of a user ID)
**x:****Display all processes, not distinguished by terminal **
4.2 Commonly used option combinations
[ root@docker-01~]# ps -aux|more ##It uses BSD format to display the process
USER PID %CPU %MEM VSZ RSS TTY STAT START TIME COMMAND
root 10.00.01281486684?Ss Nov 010:09/usr/lib/syste
md/systemd --switched-root--system--deserialize22
root 20.00.000?S Nov 010:00[kthreadd]
root 30.00.000?S Nov 010:00[ksoftirqd/0]
root 50.00.000? S<Nov 010:00[kworker/0:0H]
root 60.00.000?S Nov 010:00[kworker/u8:0]
root 70.00.000?S Nov 010:00[migration/0]
root 80.00.000?S Nov 010:00[rcu_bh]
root 90.00.000?S Nov 010:12[rcu_sched]
root 100.00.000? S<Nov 010:00[lru-add-drain
## The information contained is as follows
USER:User running the process
PID: Process ID
%CPU:CPU usage
%MEM:Memory usage
VSZ: Occupy virtual memory
RSS:Occupies real memory resident memory
TTY: The terminal where the process runs
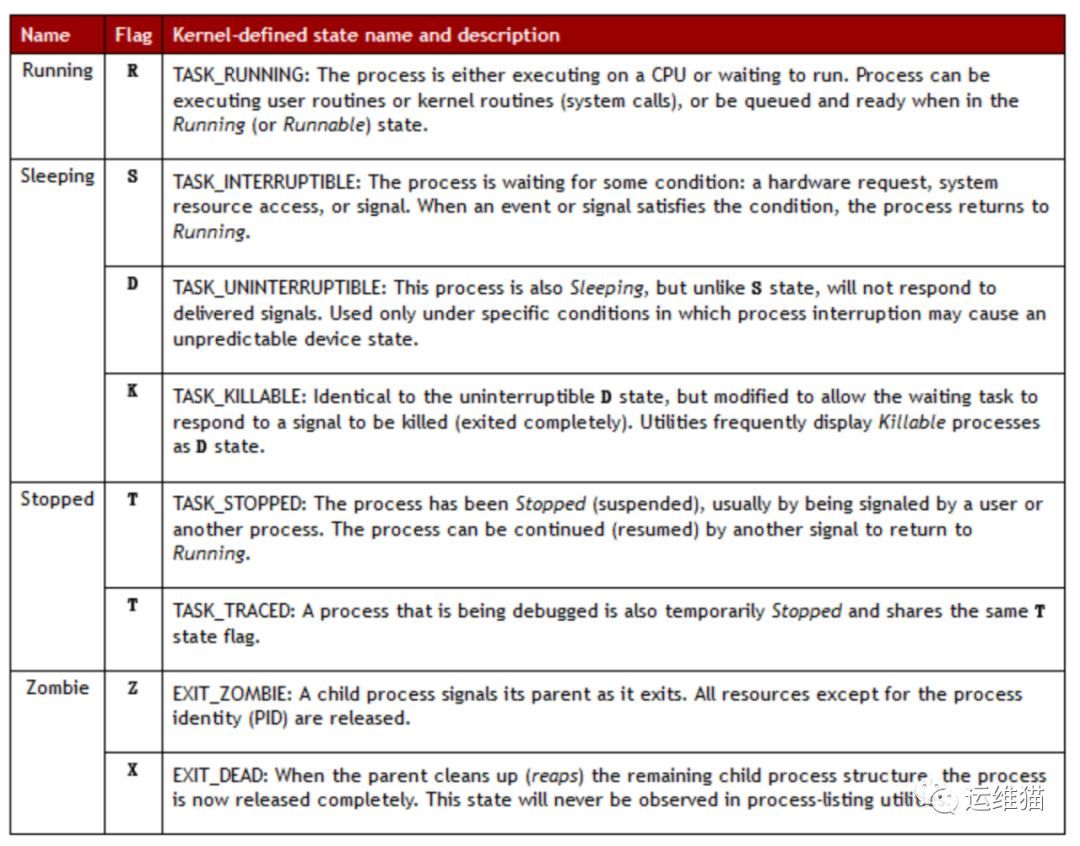
STAT: process status man ps(/STATE)
R run
S can interrupt sleep Sleep
D Uninterrupted sleep
T stopped process
Z zombie process
X dead process
Ss s process leader, parent process
S<<Higher priority process
SN N process with lower priority
R++Indicates that it is the foreground process group
Sl runs as a thread
START:Process start time
TIME: the total time the process takes up the CPU
COMMAND: process file, process name
[ root@docker-01~]# ps -ef|head ##Is to display the progress in a standard format
UID PID PPID C STIME TTY TIME CMD
root 100 Nov 01?00:00:09/usr/lib/systemd/systemd --switched-root--system--deserialize22
root 2001Jan 01?00:00:00[kthreadd]
root 32011 01 01?00:00:00[ksoftirqd/0]
root 52011 01 01?00:00:00[kworker/0:0H]
root 62011Jan 01?00:00:00[kworker/u8:0]
root 72011 Jan 01?00:00:00[migration/0]
root 82011 01 01?00:00:00[rcu_bh]
root 92011 01 01?00:00:12[rcu_sched]
root 102011 01 01?00:00:00[lru-add-drain]
## The information contained is as follows
UID:The user who started these processes
PID:ID of the process
PPID:Process ID of the parent process
C:CPU utilization in the life cycle of a process
STIME:System time when the process started
TTY:Indicates on which terminal device the process is running. If it shows?Indicates that it has nothing to do with the terminal, this kind of process is generally a kernel mode process. In addition, tty1-tty6 is the login program on this machine, if it is pts/0 and so on, it means the process running on the virtual terminal.
TIME:The total CPU time occupied by running processes
CMD:Name of the program started
4.3 Sort the specified column of the process
[ root@docker-01~]# ps aux --sort %cpu |less ##Sort ascending
 [ root@docker-01~]# ps aux --sort -%cpu |less ##Sort descending
 [ root@docker-01~]# ps aux --sort rss |less
 [ root@docker-01~]# ps aux --sort -rss |less
4.4 Uninterruptible state
[ root@docker-01~]# tar -zcvf usr-tar.gz /usr/
 ### Then keep checking the status in another terminal, by S+,R+Becomes D+[root@docker-01~]# ps -axu|grep tar
 root     254263.80.0123688 1552pts/0   R+10:310:01 tar -zcvfusr-tar.gz /usr/
 root     254470.00.0112724  984pts/1   S+10:310:00 grep--color=auto tar
 root     254263.80.0123688 1552pts/0   D+10:310:01 tar -zcvfusr-tar.gz /usr/
 root     254470.00.0112724  984pts/1   S+10:310:00 grep--color=auto tar
5、 Find the process that uses the most CPU in the system
5.1 Run top to find the process that uses the most CPU, press the uppercase P, you can sort the display by CPU usage
[ root@docker-01~]# top
 top-10:48:16 up 1day,18:41,  2users, load average:0.00,0.04,0.08
 Tasks: 111total,   2running, 109sleeping,   0stopped,   0zombie
 %Cpu(s):0.1 us,0.1 sy,0.0 ni,99.8 id,0.0 wa,0.0 hi,0.0 si,0.0
 KiB Mem : 16266520total, 11269388free,  2162204used,  2834928buff/cache
 KiB Swap:  2097148total,  2097148free,        0used. 13687952avail Mem

 PID USER     PR NI   VIRT   RES   SHR S %CPU %MEM     TIME+COMMAND
 17427 kibana    20025151641.3g  10324S   0.78.39:05.29 node
 17255 elastic+2004713976308280 15708S   0.31.911:09.30 java
**5.2 In a Linux system, a process can use up to 100% cpu, right? **
[ root@localhost ~]# top
 top-10:51:24 up 61days,23:00,  2users, load average:46.56,48.38,34.85
 Tasks: 267total,   1running, 266sleeping,   0stopped,   0zombie
 Cpu(s):96.9%us,1.6%sy,0.0%ni,0.3%id,0.0%wa,0.5%hi,0.5%si,0.2%st
 Mem: 71545156k total, 71079896k used,   465260k free,   58836k buffers
 Swap: 2097148k total,       0k used, 2097148k free, 18012268k cached

 PID USER     PR NI VIRT RES SHR S %CPU %MEM   TIME+COMMAND
 13073 smgadmin  20  05451m 1.4g 21m S 130.52.0184:57.92 java
 30753 smgadmin  20  04801m 1.3g 21m S 92.72.020:14.24 java
 ## You can see that java (dirty cow vulnerability, used for privilege escalation) process use 130.5%
Note
If you have a 4-core cpu, you can run 400%
6、 Isof view the file opened by the process, the process of opening the file, the port that the process opened (TCP, UDP)
[ root@docker-01~]# yum install lsof
 [ root@docker-01~]# vim a.txt
 [ root@docker-01~]# ps -axu | grep a.txt
 root     255260.00.0151532 5200pts/0   S+10:550:00 vima.txt
 root     255600.00.0112724 1004pts/1   S+10:570:00 grep--color=auto a.txt
 [ root@docker-01~]# lsof -p 25526 ##Generally used to view the Trojan horse process, which files are being read
 [ root@docker-01~]# lsof -i :22 ##Used to view the port, or to view which process is using the backdoor port opened by the hacker
7、 Process priority nice
7.1 Process scheduling and multitasking
Each CPU (or CPU core) can only handle one process at a time. Through time slice technology, the actual number of processes (and threads) that Linux can run can exceed the actual number of CPUs and cores available. The Linux kernel process scheduler quickly switches multiple processes on the CPU core, giving the user the impression that multiple processes are running at the same time.
7.2 Relative priority nice
Since not every process is as important as other processes, the process scheduler can be told to use different scheduling strategies for different processes. The scheduling strategy used by most processes running on conventional systems is SCHED_OTHER (also called SCHED_NORMAL), but there are other scheduling strategies for different purposes.
SCHED_OTHER The relative priority of the process running by the scheduling strategy is called the nice value of the process, which can have 40 different levels of nice values.

**The higher the nice value: the lower the priority, for example +19, the process is likely to give up CPU usage to other processes. The lower the nice value: the higher the priority, such as -20, the process is less inclined to give up the CPU. **
7.3 Nice startup level setting
 ## When starting a process, it usually inherits the nice level of the parent process, and the default is 0.
 [ root@docker-01~]# sleep 6000&[1]25601[root@docker-01~]# ps axo command,pid,nice |grep sleep
 sleep6000                 256010
 grep--color=auto sleep    256030
 ## Specify the startup level as 5[root@docker-01~]# nice -n 5 sleep 6000&[2]25605[1]Killed sleep6000
 [ root@docker-01~]# ps axo command,pid,nice |grep sleep
 sleep6000                 256055
 grep--color=auto sleep    256070
 ## Change the nice level of an existing process
 25605( Process id)The old priority is 5 and the new priority is-15[root@docker-01~]# ps axo command,pid,nice |grep sleep
 sleep6000                 25605-15
 grep--color=auto sleep    256110
Recommended Posts