Python interpolate interpolation example
I won’t say much nonsense, everyone should just look at the code~
import numpy as np
# Import the method needed for interpolation from the scipy library interpolate
from scipy import interpolate
# data visualization,Draw a scatter plot
import matplotlib.pyplot as plt
Definition function x: abscissa list y: ordinate list kind: interpolation method
f = interpolate.interp1d(x, y, kind=’cubic’)
**Interpolation method: **
nearest: nearest neighbor interpolation
zero: step interpolation
slinear, linear: linear interpolation
quadratic, cubic: 2, 3 order B-spline curve interpolation
# Define a new abscissa list
x_new=list(np.arange(0,15,0.5))
y_new=list(f(x_new))
plt.plot(x,y,'r',label='original values')
plt.plot(x_new,y_new,'b',label='interpolated values')
plt.show()
plt.close()
Supplementary knowledge: python scipy spline interpolation function (interpld function in interpolate)
scipy spline interpolation
1、 Spline interpolation is a mathematical method that uses variable splines to make a smooth curve through a series of points. The interpolation spline is composed of some polynomials, and each polynomial is determined by two adjacent data points. In this way, any two adjacent polynomials and their derivatives (excluding the derivative of the order of Qi) are at the connection point It's continuous everywhere. The smoothness and continuity of the connection points are the main differences between spline interpolation and piecewise polynomial interpolation.
2、 In Scipy, you can use the interpld function under the scipy.interpolate module to implement spline interpolation. The spline interpolation methods in version 0.14.0 of SciPy include:'linear','zero','slinear','quadratic' (2 times),'cubic' (3 times), 4, 5, etc.
3、 The application format of scipy multiple spline interpolation is as follows:
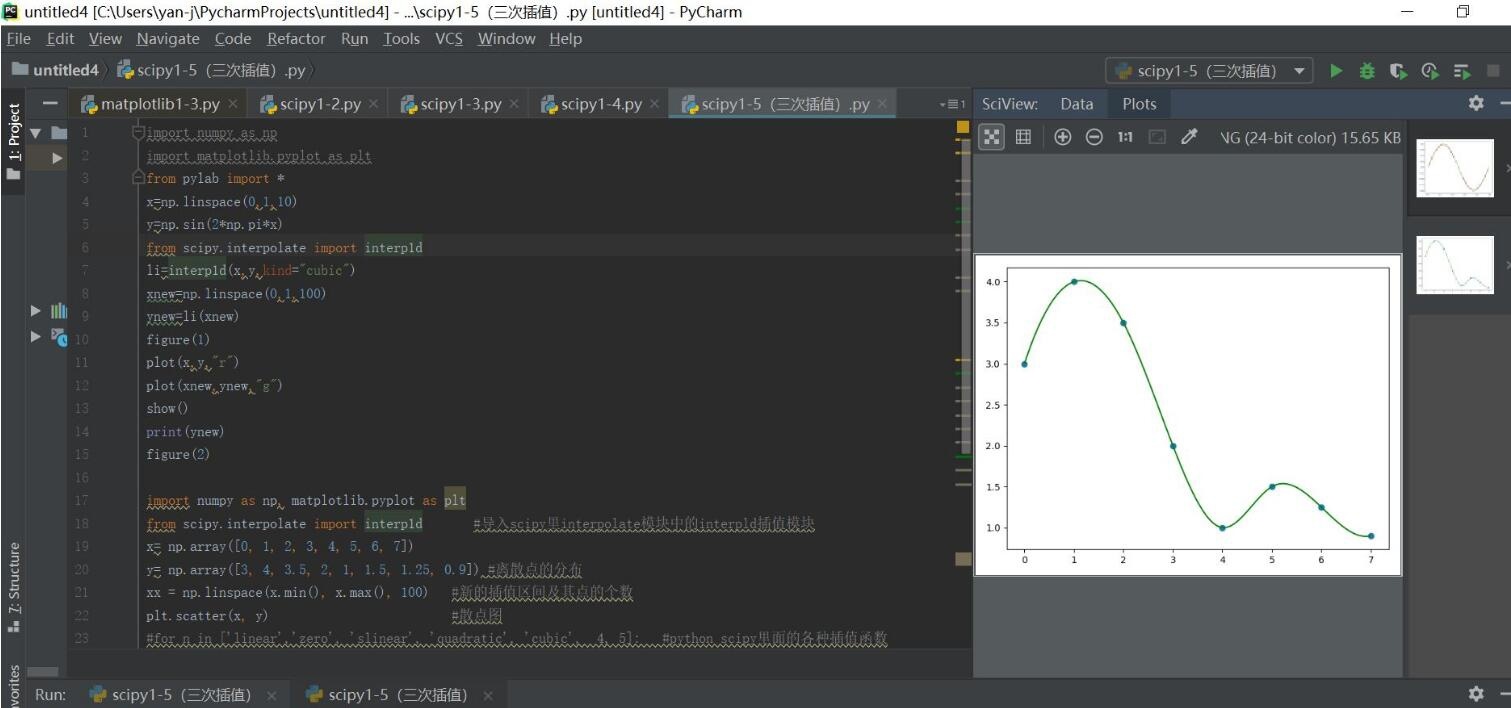
import numpy as np, matplotlib.pyplot as plt
from scipy.interpolate import interpld #Import the interpld interpolation module in the interpolate module in scipy
x= np.array([0,1,2,3,4,5,6,7])
y= np.array([3,4,3.5,2,1,1.5,1.25,0.9]) #Distribution of discrete points
xx = np.linspace(x.min(), x.max(),100) #The new interpolation interval and the number of points
plt.scatter(x, y) #Scatter plot
# for n in['linear','zero','slinear','quadratic','cubic',4,5]: #Various interpolation functions in python scipy
f =interp1d(x, y,kind="cubic") #Edit interpolation function format
ynew=f(xx) #Find a new function point through the corresponding interpolation function
plt.plot(xx,ynew,"g") #Output image of new function point
plt.show()


The above python interpolate interpolation example is all the content shared by the editor, I hope to give you a reference.
Recommended Posts