How to install Prometheus on Ubuntu 16.04
Introduction
Prometheus is a powerful open source monitoring system that can collect metrics from your services and store them in a time series database. It provides multi-dimensional data model, flexible query language and diversified visualization possibilities through [Grafana, etc.] (https://grafana.com/) tools.
By default, Prometheus only exports metrics about itself (for example, the number of requests it receives, memory consumption, etc.). However, you can greatly expand Prometheus by installing the export program and optional programs that generate other indicators.
Exporters-official publications maintained by the Prometheus team and exporters contributed by the community-provide information on everything from infrastructure, databases and web servers to messaging systems, APIs and more.
Some of the most popular options include:
- node_exporter-This will generate metrics about the infrastructure, including current CPU, memory and disk usage, as well as I/O and network statistics, such as reading from disk The number of bytes or the average load of the server.
- blackbox_exporter-This generates metrics derived from detection protocols such as HTTP and HTTPS to determine endpoint availability, response time, etc.
- mysqld_exporter-collects metrics related to the MySQL server, such as the number of queries executed, average query response time, and cluster replication status.
- rabbitmq_exporter-Export metrics related to the RabbitMQ messaging system, including the number of messages published, the number of messages to be sent, and the size of all messages in the queue.
- nginx-vts-exporter-Provides metrics about the Nginx web server using Nginx VTS module, including the number of open connections, sent The number of responses (grouped by response code) and the total size of the request sent or received (in bytes).
You can find a more complete list of official and community contributing exporters on Prometheus website.
In this tutorial, you will install, configure, and secure Prometheus and Node Exporter to generate metrics that can monitor server performance more easily.
Course Preparation
Before following this tutorial, make sure you have:
- An Ubuntu 16.04 Tencent CVM with initial server settings, including a sudo non-root user and firewall. Students who don’t have a server can buy it from here, but I personally recommend you to use the free Tencent Cloud Developer Lab for experimentation, and then buy server.
- Install Nginx in accordance with the relevant tutorials on how to install Nginx in the [Tencent Cloud + Community] (https://cloud.tencent.com/developer?from=10680) tutorial.
Step 1-Create Service User
For security reasons, we first create two new user accounts prometheus and node_exporter. We will use these accounts throughout the tutorial to isolate the ownership of Prometheus core files and directories.
Create these two users and use the --no-create-home and --shell /bin/false options so that these users cannot log in to the server.
sudo useradd --no-create-home --shell /bin/false prometheus
sudo useradd --no-create-home --shell /bin/false node_exporter
Before we download the Prometheus binary files, please create the necessary directories for storing Prometheus files and data. Following the standard Linux convention, we will create a directory in /etc for the configuration file of prometheus, and create a directory in /var/lib for its data.
sudo mkdir /etc/prometheus
sudo mkdir /var/lib/prometheus
Now, set the user and group ownership of the new directory to the prometheus user.
sudo chown prometheus:prometheus /etc/prometheus
sudo chown prometheus:prometheus /var/lib/prometheus
With our users and directories, we can now download Prometheus and create a minimal configuration file to run Prometheus for the first time.
Step 2-Download Prometheus
First, download and unzip the current stable version of Prometheus into your home directory. You can find the latest binary file and its checksum on Prometheus download page.
cd ~
curl -LO https://github.com/prometheus/prometheus/releases/download/v2.0.0/prometheus-2.0.0.linux-amd64.tar.gz
Next, use the sha256sum command to generate a checksum of the downloaded file:
sha256sum prometheus-2.0.0.linux-amd64.tar.gz
Compare the output of this command with the checksum on the Prometheus download page to ensure that your file is both genuine and undamaged.
e12917b25b32980daee0e9cf879d9ec197e2893924bd1574604eb0f550034d46 prometheus-2.0.0.linux-amd64.tar.gz
If the checksum does not match, delete the downloaded file and repeat the above steps to download the file again.
Now, unzip the downloaded archive.
tar xvf prometheus-2.0.0.linux-amd64.tar.gz
This will create a directory named prometheus-2.0.0.linux-amd64, which contains two binary files (prometheus and promtool), the directories consoles and console_libraries contain web interface files, A directory of licenses, notices and a few sample files.
Copy the two binary files to the /usr/local/bin directory.
sudo cp prometheus-2.0.0.linux-amd64/prometheus /usr/local/bin/
sudo cp prometheus-2.0.0.linux-amd64/promtool /usr/local/bin/
Set the user and group ownership of the binary file to the prometheus user created in step 1.
sudo chown prometheus:prometheus /usr/local/bin/prometheus
sudo chown prometheus:prometheus /usr/local/bin/promtool
Copy the consoles and console_libraries directories to /etc/prometheus.
sudo cp -r prometheus-2.0.0.linux-amd64/consoles /etc/prometheus
sudo cp -r prometheus-2.0.0.linux-amd64/console_libraries /etc/prometheus
Set the user and group ownership on the directory to the prometheus user. Using the -R flag will ensure ownership of the files in the directory.
sudo chown -R prometheus:prometheus /etc/prometheus/consoles
sudo chown -R prometheus:prometheus /etc/prometheus/console_libraries
Finally, delete the remaining files from the home directory, because we no longer need them.
rm -rf prometheus-2.0.0.linux-amd64.tar.gz prometheus-2.0.0.linux-amd64
Now that Prometheus is installed, we will create its configuration and service files in preparation for the first run.
Step 3-Configure Prometheus
In the /etc/prometheus directory, use nano or your favorite text editor to create a configuration file named prometheus.yml. For now, this file will contain enough information to run Prometheus for the first time.
sudo nano /etc/prometheus/prometheus.yml
**Warning: ** The configuration file of Prometheus uses YAML format. This format strictly prohibits tabs and requires two spaces to indent. If the configuration file format is incorrect, Prometheus will not start.
In the global setting, define the default time interval for crawling indicators. Note that unless individual exporters' own settings override global variables, Prometheus will apply these settings to each exporter.
global:
 scrape_interval: 15s
The scrape_interval value tells Prometheus to collect metrics from its exporters every 15 seconds, which is long enough for most exporters.
Now, use the following scrape_configs directive to add Prometheus itself to the list of exporters:
...
scrape_configs:- job_name:'prometheus'
 scrape_interval: 5s
 static_configs:- targets:['localhost:9090']
Prometheus uses job_name to mark exporters on labels and charts, so be sure to choose descriptive content here.
Moreover, since Prometheus exports important data that can be used for performance monitoring and debugging, we rewrite the global scrape_interval instruction from 15 seconds to 5 seconds to update more frequently.
Finally, Prometheus uses the static_configs and targets instructions to determine where the exporter runs. Since this particular exporter runs on the same server as Prometheus itself, we can use the localhost IP address instead of the default port 9090 instead of the IP address.
Your configuration file should now look like this:
global:
scrape_interval: 15s
scrape_configs:- job_name:'prometheus'
scrape_interval: 5s
static_configs:- targets:['localhost:9090']
Save the file and exit the text editor.
Now, set the user and group ownership on the configuration file to the prometheus user created in step 1.
sudo chown prometheus:prometheus /etc/prometheus/prometheus.yml
After the configuration is complete, we are ready to run it for the first time to test Prometheus.
Step 4-Run Prometheus
Start Prometheus as the prometheus user and provide the path for the configuration file and data directory.
sudo -u prometheus /usr/local/bin/prometheus \
 - - config.file /etc/prometheus/prometheus.yml \
 - - storage.tsdb.path /var/lib/prometheus/ \
 - - web.console.templates=/etc/prometheus/consoles \
 - - web.console.libraries=/etc/prometheus/console_libraries
The output contains information about Prometheus loading progress, configuration files and related services. This also confirms that Prometheus is listening on port 9090.
Outputlevel=info ts=2017-11-17T18:37:27.474530094Z caller=main.go:215 msg="Starting Prometheus" version="(version=2.0.0, branch=HEAD, re
vision=0a74f98628a0463dddc90528220c94de5032d1a0)"
level=info ts=2017-11-17T18:37:27.474758404Z caller=main.go:216 build_context="(go=go1.9.2, user=root@615b82cb36b6, date=20171108-07:11:59)"
level=info ts=2017-11-17T18:37:27.474883982Z caller=main.go:217 host_details="(Linux 4.4.0-98-generic #121-Ubuntu SMP Tue Oct 1014:24:03 UTC 2017 x86_64 prometheus-update(none))"
level=info ts=2017-11-17T18:37:27.483661837Z caller=web.go:380 component=web msg="Start listening for connections" address=0.0.0.0:9090
level=info ts=2017-11-17T18:37:27.489730138Z caller=main.go:314 msg="Starting TSDB"
level=info ts=2017-11-17T18:37:27.516050288Z caller=targetmanager.go:71 component="target manager" msg="Starting target manager...
"
level=info ts=2017-11-17T18:37:27.537629169Z caller=main.go:326 msg="TSDB started"
level=info ts=2017-11-17T18:37:27.537896721Z caller=main.go:394 msg="Loading configuration file" filename=/etc/prometheus/promethe
us.yml
level=info ts=2017-11-17T18:37:27.53890004Z caller=main.go:371 msg="Server is ready to receive requests."
If you receive an error message, double check whether you are using YAML syntax in the configuration file, and then follow the instructions on the screen to solve the problem.
Now, press CTRL+C to stop Prometheus, and then open a new systemd service file.
sudo nano /etc/systemd/system/prometheus.service
The service file tells systemd that you run Prometheus as the prometheus user, and the configuration file is located in the /etc/prometheus/prometheus.yml directory, and its data is stored in /var/lib/prometheus Directory. (The details of the systemd service file are beyond the scope of this tutorial, but you can learn more in Tencent Cloud + Community.)
Copy the following into the file:
[ Unit]
Description=Prometheus
Wants=network-online.target
After=network-online.target
[ Service]
User=prometheus
Group=prometheus
Type=simple
ExecStart=/usr/local/bin/prometheus \
- - config.file /etc/prometheus/prometheus.yml \
- - storage.tsdb.path /var/lib/prometheus/ \
- - web.console.templates=/etc/prometheus/consoles \
- - web.console.libraries=/etc/prometheus/console_libraries
[ Install]
WantedBy=multi-user.target
Finally, save the file and close the text editor.
To use the newly created service, reload systemd.
sudo systemctl daemon-reload
You can now start Prometheus with the following command:
sudo systemctl start prometheus
To make sure that Prometheus is running, check the status of the service.
sudo systemctl status prometheus
The output will tell you the status of Prometheus, the main process identifier (PID), memory usage, etc.
If the status of the service is not active, please follow the instructions on the screen and re-track the above steps to solve the problem before continuing this tutorial.
● prometheus.service - Prometheus
 Loaded:loaded(/etc/systemd/system/prometheus.service; disabled; vendor preset: enabled)
 Active:active(running) since Fri 2017-07-2111:40:40 UTC; 3s ago
 Main PID:2104(prometheus)
 Tasks:7
 Memory:13.8M
  CPU: 470ms
 CGroup:/system.slice/prometheus.service
...
When you are ready to move on, press Q to exit the status command.
Finally, enable the service to start at boot.
sudo systemctl enable prometheus
Now that Prometheus is up and running, we can install an additional exporter to generate metrics about our server resources.
Step 5-Download Node Exporter
To extend Prometheus beyond metrics only about itself, we will install another exporter called Node Exporter. The node exporter provides detailed information about the system, including CPU, disk and memory usage.
First, download the current stable version of Node Exporter to your home directory. You can find the latest binary file and its checksum on Prometheus download page.
cd ~
curl -LO https://github.com/prometheus/node_exporter/releases/download/v0.15.1/node_exporter-0.15.1.linux-amd64.tar.gz
Use the sha256sum command to generate the checksum of the downloaded file:
sha256sum node_exporter-0.15.1.linux-amd64.tar.gz
Verify the integrity of the downloaded file by comparing its checksum with the checksum on the download page.
7 ffb3773abb71dd2b2119c5f6a7a0dbca0cff34b24b2ced9e01d9897df61a127 node_exporter-0.15.1.linux-amd64.tar.gz
If the checksum does not match, delete the downloaded file and repeat the above steps.
Now, unzip the downloaded archive.
tar xvf node_exporter-0.15.1.linux-amd64.tar.gz
This will create a directory named node_exporter-0.15.1.linux-amd64 that contains binary files named node_exporter, licenses and notifications.
Copy the binary file to the /usr/local/bin directory and set the user and group ownership to the node_exporter user you created in step 1.
sudo cp node_exporter-0.15.1.linux-amd64/node_exporter /usr/local/bin
sudo chown node_exporter:node_exporter /usr/local/bin/node_exporter
Finally, delete the remaining files from the home directory, because we no longer need them.
rm -rf node_exporter-0.15.1.linux-amd64.tar.gz node_exporter-0.15.1.linux-amd64
Now that you have installed Node Exporter, let us run it before creating a service file for it, and use this to test it so that it starts at boot.
Step 6-Run Node Exporter
The steps for running Node Exporter are similar to those for running Prometheus itself. First create a Systemd service file for Node Exporter.
sudo nano /etc/systemd/system/node_exporter.service
This service file tells your system to run Node Exporter as the node_exporter user and enable the default collector set.
Copy the following into the service file:
[ Unit]
Description=Node Exporter
Wants=network-online.target
After=network-online.target

[ Service]
User=node_exporter
Group=node_exporter
Type=simple
ExecStart=/usr/local/bin/node_exporter

[ Install]
WantedBy=multi-user.target
The collector defines which metrics the node exporter will generate. You can view the complete collector list of Node Exporter in Node Exporter README-including the list of collectors that are enabled by default and deprecated.
If you need to override the default collector list, you can use the --collectors.enabled flag, such as:
...
ExecStart=/usr/local/bin/node_exporter --collectors.enabled meminfo,loadavg,filesystem
...
The previous example will tell the node exporter to use only the meminfo, loadavg and filesystem collectors to generate metrics. You can limit the collectors to few or many according to your needs, but please note that there are no spaces before or after the comma.
Save the file and close the text editor.
Finally, reload systemd to use the newly created service.
sudo systemctl daemon-reload
You can now run Node Exporter with the following command:
sudo systemctl start node_exporter
Use the status command to verify that the node exporter is running correctly.
sudo systemctl status node_exporter
As before, this output tells you the status of the node exporter, the main process identifier (PID), memory usage, etc.
If the status of the service is not active, please follow the message on the screen and re-track the above steps to solve the problem before continuing.
● node_exporter.service - Node Exporter
 Loaded:loaded(/etc/systemd/system/node_exporter.service; disabled; vendor preset: enabled)
 Active:active(running) since Fri 2017-07-2111:44:46 UTC; 5s ago
 Main PID:2161(node_exporter)
 Tasks:3
 Memory:1.4M
  CPU: 11ms
 CGroup:/system.slice/node_exporter.service
Finally, enable the node exporter to start at boot.
sudo systemctl enable node_exporter
With Node Exporter fully configured and operating as expected, we will tell Prometheus to start crawling new metrics.
Step 7-Configure Prometheus to scrape the node exporter
Because Prometheus only grabs exporters defined in the scrape_configs section of its configuration file, we need to add an entry for Node Exporter, just like we did for Prometheus itself.
Open the configuration file.
sudo nano /etc/prometheus/prometheus.yml
At the end of the scrape_configs block, add a new entry called node_exporter.
...- job_name:'node_exporter'
 scrape_interval: 5s
 static_configs:- targets:['localhost:9100']
Since this exporter is also running on the same server as Prometheus itself, we can again use localhost instead of the IP address, and also use the default 9100 port of Node Exporter.
Your entire configuration file should look like this:
global:
 scrape_interval: 15s

scrape_configs:- job_name:'prometheus'
 scrape_interval: 5s
 static_configs:- targets:['localhost:9090']- job_name:'node_exporter'
 scrape_interval: 5s
 static_configs:- targets:['localhost:9100']
When you are ready to continue, save the file and exit the text editor.
Finally, restart Prometheus for the changes to take effect.
sudo systemctl restart prometheus
Use the status command again to verify that everything is running normally.
sudo systemctl status prometheus
If the service status is not set to active, please follow the instructions on the screen and re-track the previous steps before proceeding.
● prometheus.service - Prometheus
 Loaded:loaded(/etc/systemd/system/prometheus.service; disabled; vendor preset: enabled)
 Active:active(running) since Fri 2017-07-2111:46:39 UTC; 6s ago
 Main PID:2219(prometheus)
 Tasks:6
 Memory:19.9M
  CPU: 433ms
 CGroup:/system.slice/prometheus.service
We have now installed, configured and run Prometheus and Node Exporter. As a last precaution before connecting to the web interface, we will enhance the security of the installation through basic HTTP authentication to ensure that unauthorized users cannot access our indicators.
Step 8-Protect Prometheus
Prometheus does not include built-in authentication or any other general security mechanisms. On the one hand, this means that you will get a highly flexible system with fewer configuration restrictions; on the other hand, it means that you need to ensure that your indicators and overall settings are sufficiently secure.
For simplicity, we will use Nginx to add basic HTTP authentication to our installation, which is fully supported by Prometheus and its preferred Data Visualization tool Grafana.
First install apache2-utils, which will give you access to the utility htpasswd for generating password files.
sudo apt-get update
sudo apt-get install apache2-utils
Now, create a password file by telling htpasswd where you want to store the file and the username you want to use for authentication.
**Note: **htpasswd will prompt you to enter and reconfirm the password you want to associate with this user. Also, please write down the username and password you entered here, because you need to log in to Prometheus in step 9.
sudo htpasswd -c /etc/nginx/.htpasswd sammy
The result of this command is a newly created file .htpasswd located in the directory /etc/nginx, which contains the hashed version of the username and the password you entered.
Next, configure Nginx to use the newly created password.
First, make a Prometheus-specific copy of the default Nginx configuration file so that you can revert to the default value if you encounter problems later.
sudo cp /etc/nginx/sites-available/default/etc/nginx/sites-available/prometheus
Then, open the new configuration file.
sudo nano /etc/nginx/sites-available/prometheus
Find the server block under the location / block. It should look like:
...
 location /{
  try_files $uri $uri/=404;}...
Since we forward all traffic to Prometheus, please replace the try_files directive with the following:
...
 location /{
  auth_basic "Prometheus server authentication";
  auth_basic_user_file /etc/nginx/.htpasswd;
  proxy_pass http://localhost:9090;
  proxy_http_version 1.1;
  proxy_set_header Upgrade $http_upgrade;
  proxy_set_header Connection 'upgrade';
  proxy_set_header Host $host;
  proxy_cache_bypass $http_upgrade;}...
These settings ensure that users must be authenticated at the beginning of each new session. In addition, the reverse proxy will direct all requests processed by this block to Prometheus.
After making changes, save the file and close the text editor.
Now, deactivate the default Nginx configuration file by deleting the link in the /etc/nginx/sites-enabled directory, and activate the new configuration file by creating a link to it.
sudo rm /etc/nginx/sites-enabled/default
sudo ln -s /etc/nginx/sites-available/prometheus /etc/nginx/sites-enabled/
Before restarting Nginx, use the following command to check the configuration for errors:
sudo nginx -t
The output should indicate syntax is ok and test is successful. If you receive an error message, follow the instructions on the screen to resolve the issue before proceeding to the next step.
nginx: the configuration file /etc/nginx/nginx.conf syntax is ok
nginx: configuration file /etc/nginx/nginx.conf test is successful
Then, reload Nginx to include all changes.
sudo systemctl reload nginx
Verify that Nginx is up and running.
sudo systemctl status nginx
If your output does not indicate the status of the service active, follow the message on the screen to re-track the above steps to solve the problem before continuing.
● nginx.service - A high performance web server and a reverse proxy server
 Loaded:loaded(/lib/systemd/system/nginx.service; enabled; vendor preset: en
 Active:active(running) since Mon 2017-07-3121:20:57 UTC; 12min ago
 Process:4302 ExecReload=/usr/sbin/nginx -g daemon on; master_process on;-s r
 Main PID:3053(nginx)
 Tasks:2
 Memory:3.6M
  CPU: 56ms
 CGroup:/system.slice/nginx.service
At this point, we have a fully functional and secure Prometheus server, so we can log in to the web interface to start viewing metrics.
Step 9-Test Prometheus
Prometheus provides a basic web interface for monitoring the status of itself and its exporters, executing queries and generating graphs. However, due to the simplicity of the interface, the Prometheus team recommendedinstall and use Grafana instead of testing and debugging.
In this tutorial, we will use the built-in web interface to ensure that Prometheus and Node Exporter are running properly, and we will also look at simple queries and graphs.
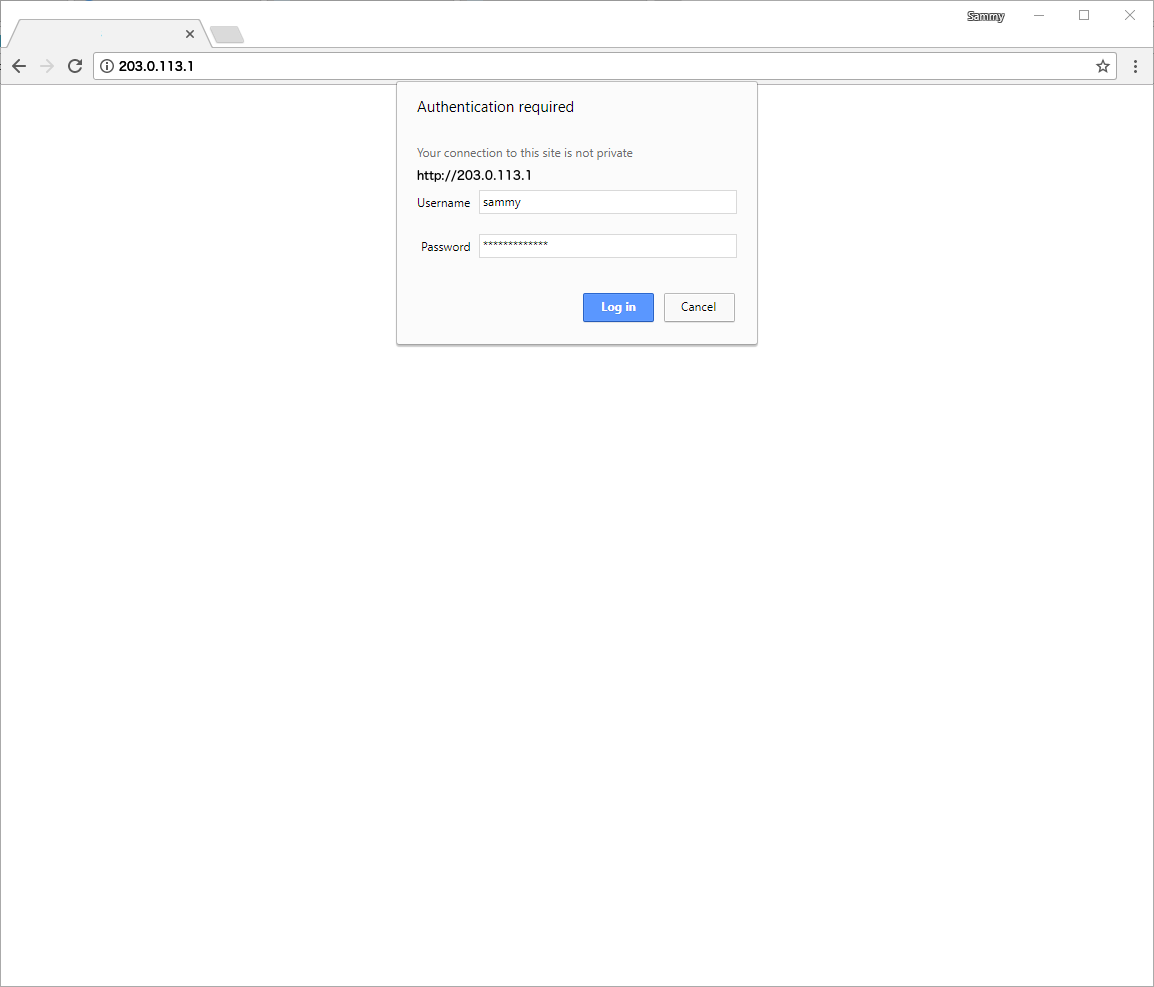
First, point your web browser to http://your_server_ip.
In the HTTP authentication dialog box, enter the username and password you selected in step 8.
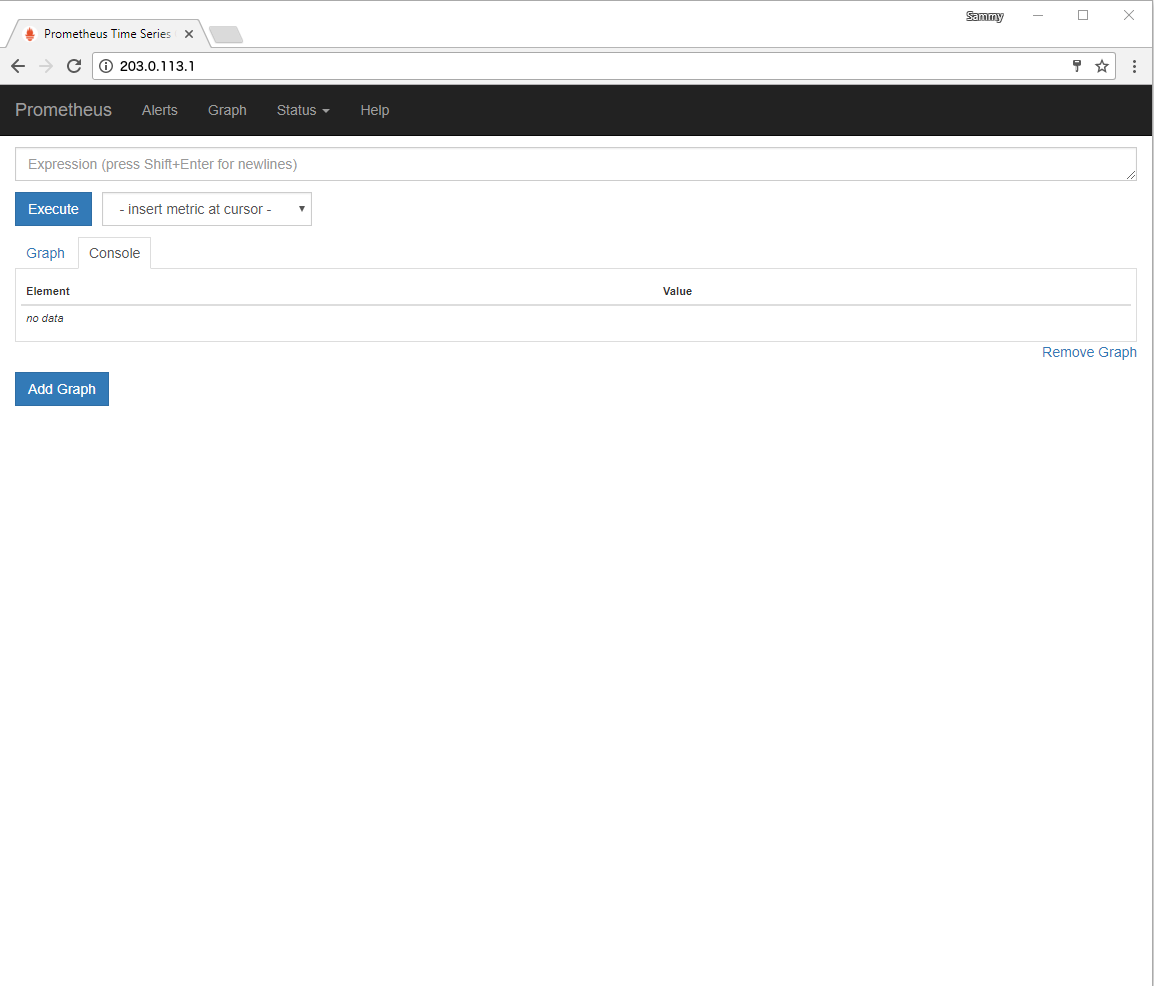
After logging in, you will see Expression Browser, where you can execute and visualize custom queries.

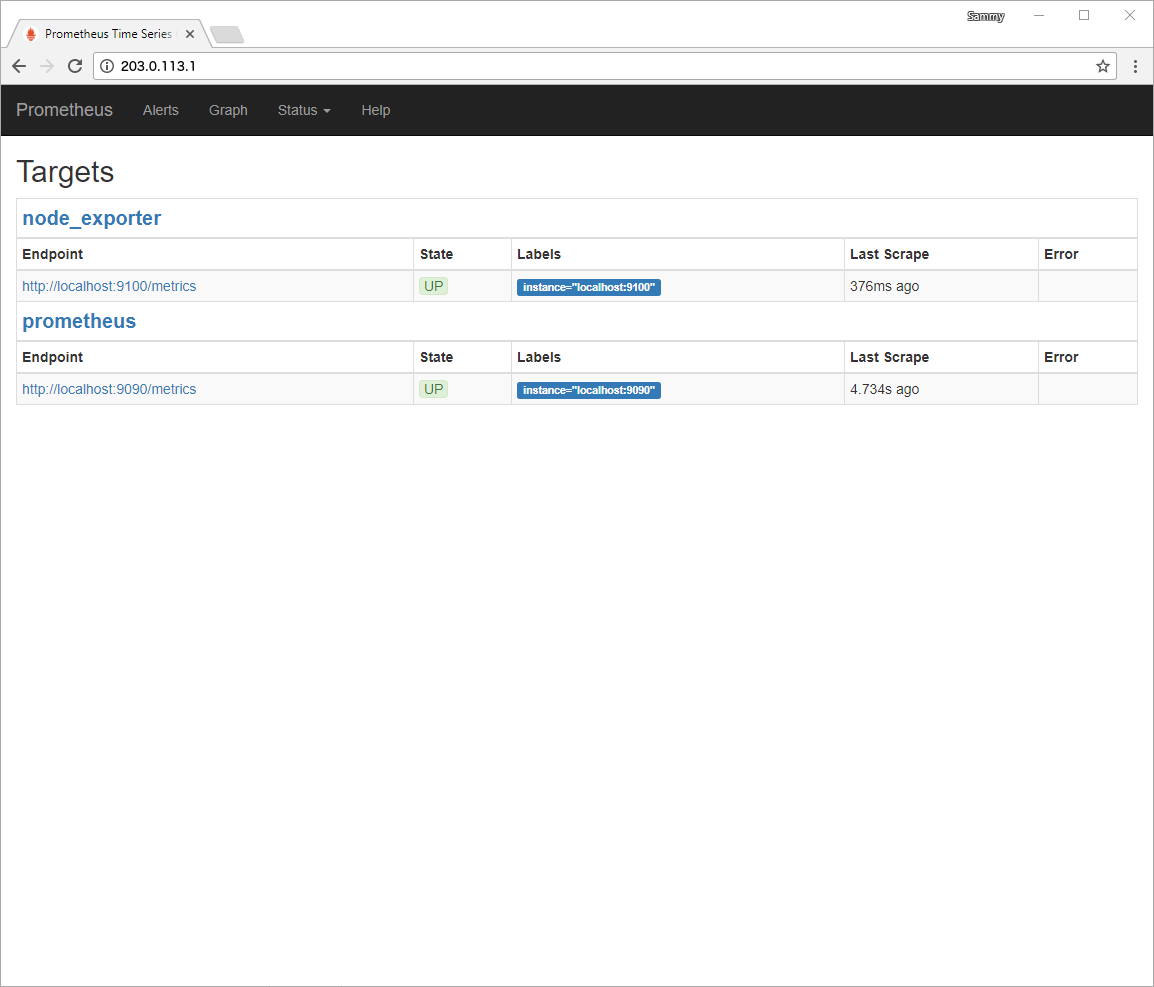
Before executing any expressions, first click the Status menu at the top of the screen, and then click the Targets menu option to verify the status of Prometheus and Node Explorer. Since we have configured Prometheus as itself and the node exporter, you should see two targets listed in the UP status.
If the exporter is missing or an error message is displayed, use the following command to check the status of the service:
sudo systemctl status prometheus
sudo systemctl status node_exporter
The output of the two services should report the status Active: active (running). If a service is completely inactive or active but still not working properly, follow the instructions on the screen and re-track the previous steps before continuing.
Next, to ensure that the exporter works properly, we will execute some expressions against the Node Exporter.
First, click the "Graph" menu at the top of the screen to return to the "Expression Browser".
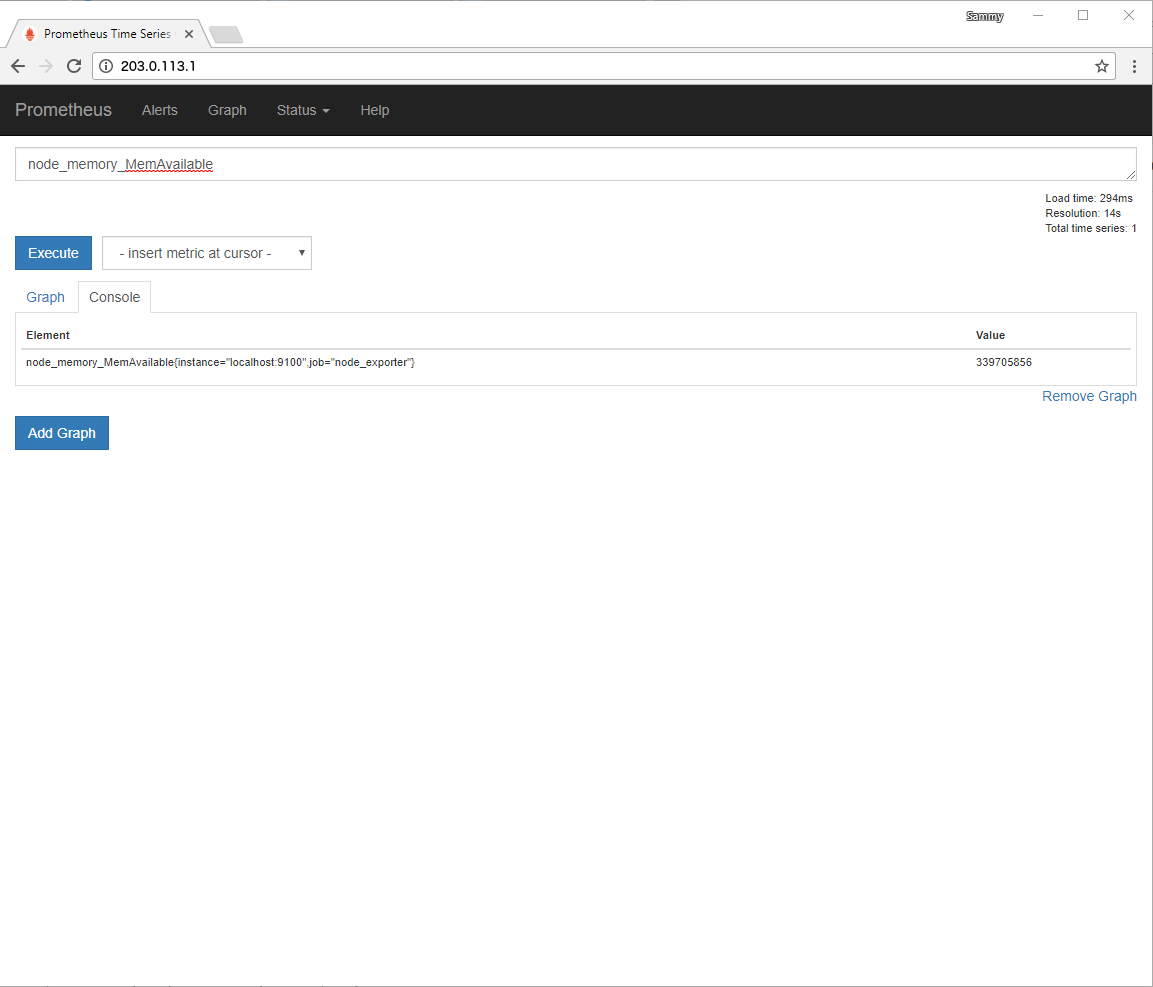
In the "Expression" field, type node_memory_MemAvailable and press the "Execute" button to update the "Console" tab with the amount of memory the server has.
By default, the node exporter reports this amount in bytes. To convert to megabytes, we will use the mathematical operator to divide by 1024 twice.
In the "Expression" field, enter node_memory_MemAvailable/1024/1024 and press the "Execute" button.
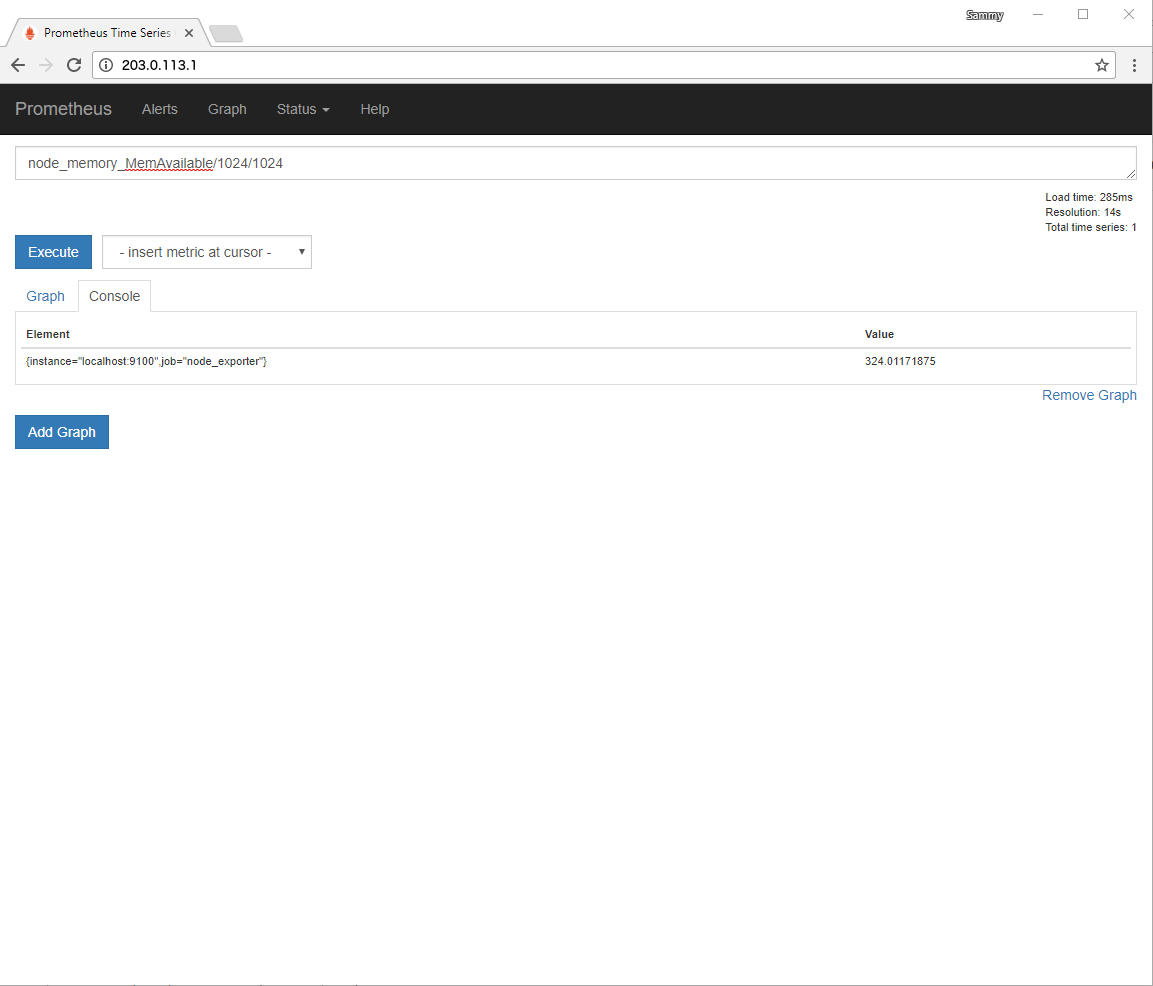
The "Console" tab will now display the results in megabytes.
If you want to verify the result, execute the free command from the terminal. (The -h flag tells free to send us the report in a human-readable format, in megabytes.)
free -h
This output contains detailed information about memory usage, including the available memory shown in the Available column.
    total        used        free      shared  buff/cache   available
Mem:           488M        144M         17M        3.7M        326M        324M
Swap:            0B          0B          0B
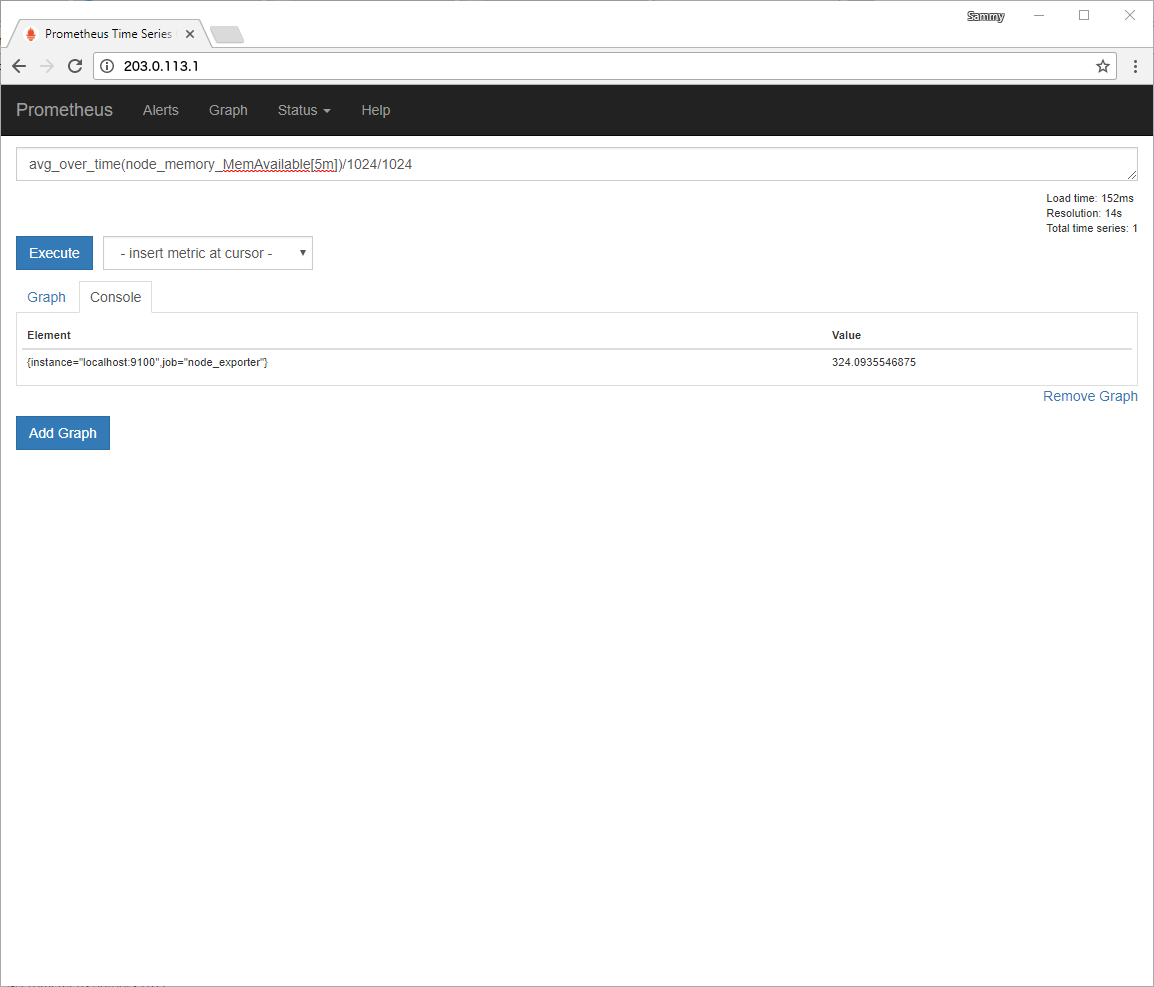
In addition to basic operators, the Prometheus query language also provides many functions for aggregating results.
In the "Expression" field, type avg_over_time(node_memory_MemAvailable[5m])/1024/1024 and click the "Execute" button. The result will be the average available memory (in megabytes) over the past 5 minutes.
Now, clicking the Graph tab displays the executed expression as a graph instead of text.
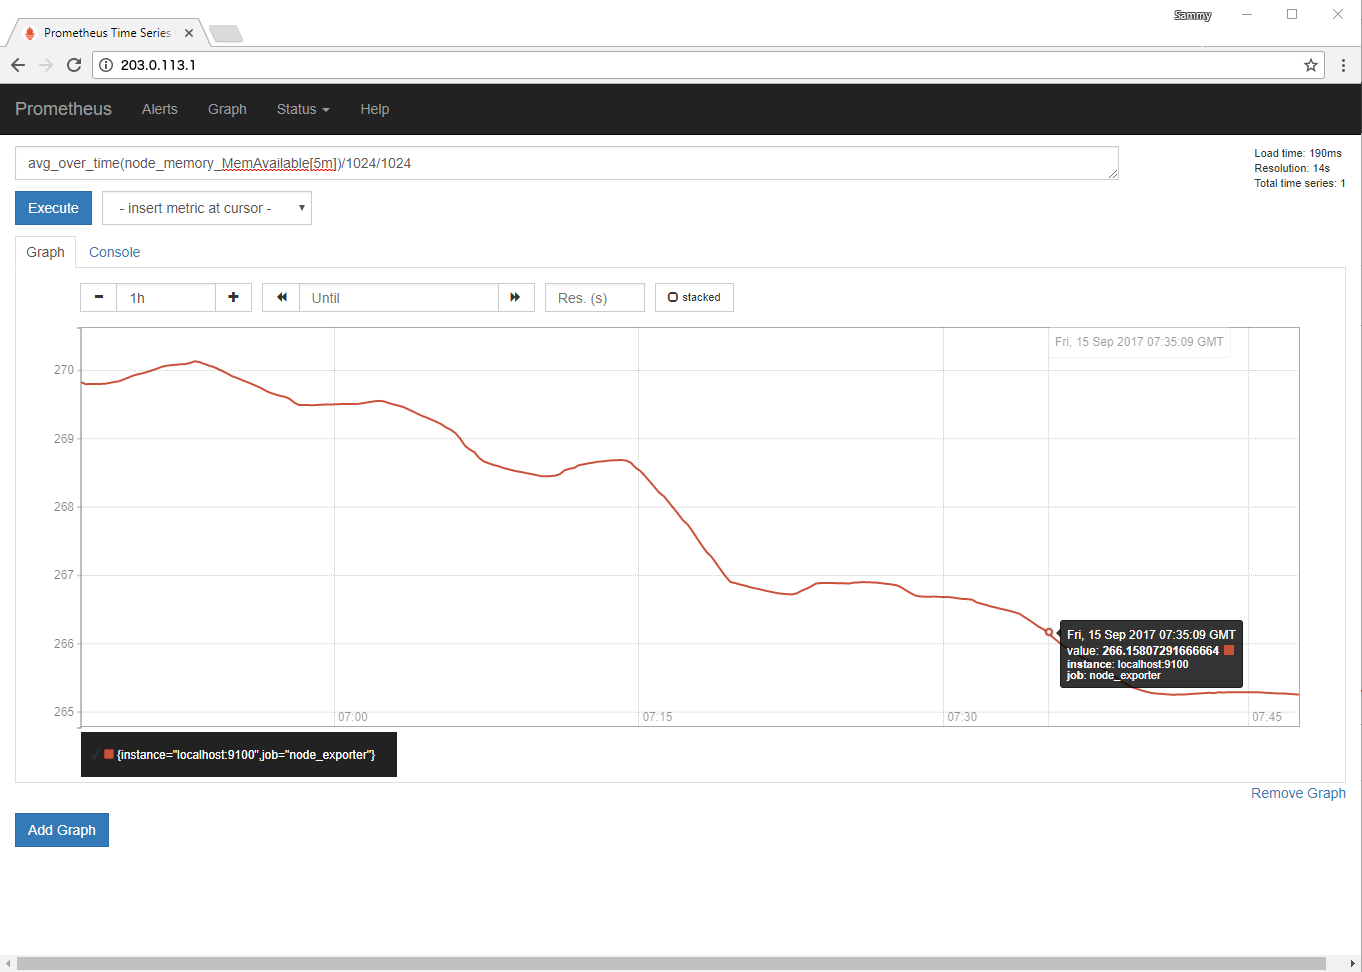
Finally, on this tab, hover your mouse over the chart to get additional details about any specific point on the X and Y axis of the chart.
If you want to learn more about creating expressions in Prometheus' built-in web interface, please refer to the Query Prometheus section in the official documentation.
in conclusion
In this tutorial, we used an additional exporter to download, configure, secure, and test the complete Prometheus installation.
To learn what else Prometheus can do, please visit Prometheus official documentation.
And, to learn more about extending Prometheus, please check Available Exporters List and Grafana Official Website.
For more Ubuntu tutorials, please go to [Tencent Cloud + Community] (https://cloud.tencent.com/developer?from=10680) to learn more.
Reference: "How To Install Prometheus on Ubuntu 16.04"
Recommended Posts