How to install Prometheus with Docker on Ubuntu 14.04
Introduction
Prometheus is an open source monitoring system and time series database. It involves many aspects of monitoring, such as the generation and collection of metrics, plotting result data on dashboards, and issuing alerts for abnormal situations. To achieve this goal, it provides various components that operate separately but in combination.
Docker provides you with a way to encapsulate server processes using Linux containers (or other packaging technologies) to make it easier to manage and isolate them. To learn more about Docker, please refer to Docker Ecosystem: Introduction to Common Components.
In this tutorial, we will learn how to install the three key components of Prometheus on Docker. these are:
- Prometheus server, used to collect metrics and query them
- Node exporter, export system metrics in Prometheus compatible format
- Grafana, a web-based graphical dashboard builder that supports Prometheus and other backends
There are more components in the Prometheus ecosystem, but these three components provide a good starting point for using Prometheus.
Preparation
To follow this tutorial, you need:
- Ubuntu 14.04 Tencent Cloud CVM
- An Ubuntu** server** with a non-root account that can use the
sudocommand has been set up, and the firewall has been turned on. Students who don’t have a server can buy it from here, but I personally recommend you to use the free Tencent Cloud Developer Lab for experimentation, and then buy server.
**Note: **This article has been tested on a 1 CPU / 512 MB RAM Ubuntu 14.04 Droplet. The Prometheus configuration should be adjusted according to the instructions in step 1 of this article to obtain different amounts of available resources.
Step 1-Install Prometheus
This section will introduce how to install the main Prometheus server using Docker. Before proceeding, make sure to install Docker in accordance with the "Prerequisites" section. The Prometheus server is the core part of the Prometheus ecosystem, responsible for collecting and storing metrics, processing expression queries and generating alerts.
Docker container images of all Prometheus components are hosted under the prom organization on Docker Hub. Running the prom/prometheus Docker image without any other options will start the Prometheus server, which contains a sample configuration file located inside the /etc/prometheus/prometheus.yml container. It also uses the /prometheus Docker data volume installed inside the container to store the collected metric data. This data volume directory is actually a directory on the host, and Docker automatically creates this directory when the container is started for the first time. The data in it remains unchanged between restarts of the same container.
There are multiple ways to override the default configuration file. For example, a custom configuration file can be passed as a Docker data volume from the host file system to the container, or you can choose to build a derived Docker container and bake your own configuration file into the container image. In this tutorial, we will choose to import the configuration file from the host system.
There are also different modes for the storage of organizational metrics. In this tutorial, we will use the default behavior of Docker image-use Docker data volume to store metrics. You can also consider creating a data volume container to better meet your needs.
First, create a minimal Prometheus configuration file ~/prometheus.yml on the host file system:
nano ~/prometheus.yml
Add the following to the file (replace your_server_ip with the IP address of the Droplet):
# A scrape configuration scraping a Node Exporter and the Prometheus server
# itself.
scrape_configs:
# Scrape Prometheus itself every 5 seconds.- job_name:'prometheus'
scrape_interval: 5s
target_groups:- targets:['localhost:9090']
# Scrape the Node Exporter every 5 seconds.- job_name:'node'
scrape_interval: 5s
target_groups:- targets:['your_server_ip:9100']
This example configuration enables Prometheus to obtain metrics from itself (because Prometheus also exposes metrics in a format compatible with Prometheus) and the node exporter we will set up later. Although Prometheus can use the localhost hostname to connect to itself within its container, it needs to use the server's external IP to scrape the Node Exporter, because the Node Exporter will run in a separate container with a separate network namespace.
Start the Prometheus Docker container using an external configuration file:
docker run -d -p 9090:9090-v ~/prometheus.yml:/etc/prometheus/prometheus.yml prom/prometheus -config.file=/etc/prometheus/prometheus.yml -storage.local.path=/prometheus -storage.local.memory-chunks=10000
The first time you run this command, it will pull the Docker image from Docker Hub.
This command is very long and contains many command line options. Let's look at it in more detail:
- The
-doption starts the Prometheus container in detached mode, which means that the container will start in the background and will not be terminated by pressingCTRL+C. - The
-p 9090:9090option exposes the Prometheus web port (9090) and makes it accessible through the external IP address of the host system. - The
-v [...]option installs theprometheus.ymlconfiguration file from the host file system to the location where Prometheus expects its container (/etc/prometheus/prometheus.yml). - The
-config.fileoption is set according to the location of the container Prometheus configuration file. - The
-storage.local.pathoption configures the storage location of the metrics in the *container. - Finally, the
-storage.local.memory-chunksoption adjusts the memory usage of Prometheus to a very small amount of RAM (only 512MB) of the host system and a small amount of time series (less than 1000) stored in this tutorial. It instructs Prometheus to keep only 10,000 sample blocks in memory (approximately 10 blocks per series) instead of the default value of 1048576. This is when running Prometheus on a machine with more RAM and more time storage Values that definitely need to be adjusted series. For more detailed information on this issue, please refer to Prometheus's Storage Document.
You can list all running Docker containers with the following command:
docker ps
For example, you will see the following similar to the Prometheus Docker container:
CONTAINER ID        IMAGE                COMMAND                  CREATED             STATUS              PORTS                    NAMES
6 a89ac39911e        prom/prometheus      "/bin/prometheus -con"2 hours ago         Up 2 hours          0.0.0.0:9090->9090/tcp   stoic_pike
Using the container ID shown in the output of docker ps, you can check the logs of the running Prometheus server with the following command:
docker logs container_id
In our example, the command will be:
docker logs 6a89ac39911e
To find out the location of the host file system where the indicator storage volume is stored, you can run the following command using container_id:
docker inspect container_id
This will output information about the container configuration, including the host path of any installed Docker volumes.
Find something similar to this in the output:
..." Mounts":[{"Source":"/home/sammy/prometheus.yml","Destination":"/etc/prometheus/prometheus.yml","Mode":"","RW":true},{"Name":"821b0abc470a9c758ff35ed5cff69077423a629566082a605a01d8207d57cd6c","Source":"/var/lib/docker/volumes/821b0abc470a9c758ff35ed5cff69077423a629566082a605a01d8207d57cd6c/_data","Destination":"/prometheus","Driver":"local","Mode":"","RW":true}],...
In this example, the metrics are stored on the /var/lib/docker/volumes/821b0abc470a9c758ff35ed5cff69077423a629566082a605a01d8207d57cd6c/_data host system. When the Prometheus container is started for the first time, Docker will automatically create this directory. It maps to a directory in the /prometheus container. The data in this directory remains unchanged when the same container is restarted. If you prefer, you can also install an existing host directory to store metric data.
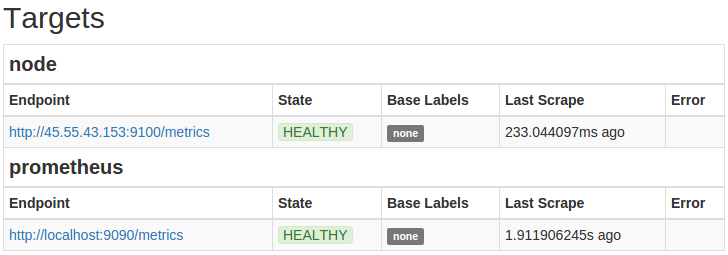
You should now be able to access the Prometheus server at http://your_server_ip:9090/. Verify that it is collecting information about itself by pointing to http://your_server_ip:9090/status in the "Target" section and finding the http://localhost:9090/metrics endpoint of the prometheus job index of. The State column for this goal should show the state of the goal as HEALTHY. In contrast, the http://localhost:9100/metrics (node exporter) endpoint should still be displayed as **UNHEALTHY, ** because the node exporter has not been started, it cannot be deleted:

All in all, you are now running Prometheus as a Docker container using a custom Prometheus configuration file, which is located on the host file system ~/prometheus.yml. The metric storage is located in the /prometheus directory in the container, which is backed up on the host system through the path shown by the docker inspect command described in this section.
Step 2-Set up node exporter
In this section, we will install the Prometheus node exporter. The node exporter is a server that exposes Prometheus metrics about the host (node) that is running. This includes indicators about computer file systems, network equipment, processor usage, memory usage, etc.
Please note that running Node Exporter on Docker brings some challenges, as its entire purpose is to expose metrics about the host it is running on. If we run it on Docker without other options, the namespace of resources such as Docker's file system and network devices will cause it to only export metrics about the container environment, which will be different from the host's environment. Therefore, it is usually recommended to run Node Exporter directly on a host system other than Docker. However, if you need to use Docker to manage all processes, we will describe a solution that provides a reasonable approximation of exporting host metrics from Docker.
Use Docker to start the node exporter on port 9100:
docker run -d -p 9100:9100-v "/proc:/host/proc"-v "/sys:/host/sys"-v "/:/rootfs"--net="host" prom/node-exporter -collector.procfs /host/proc -collector.sysfs /host/proc -collector.filesystem.ignored-mount-points "^/(sys|proc|dev|host|etc)($|/)"
The following Docker and Node Exporter flags are used to provide a reasonable approximation for the host metric:
- On Linux, the node exporter brings together most of the indicators from its
/procand/sysfile systems. These file systems/hostuse Docker's-vflag to install from the host into the container under the directory. - Through the node exporter
-collector.procfsand-collector.sysfsflags, we instruct the node exporter to look for the/procand/sysfile systems in non-standard locations. - In order to report the host file system metrics, we also use the Docker flag to mount the entire root (
/) file system into the container (at/rootfs)-v. - Use the
-collector.filesystem.ignored-mount-pointsflag of the node exporter to ignore any other file systems in the container that are not part of the host system. This option uses regular expression mount points to exclude from the reported metrics. - Using the
--net=hostDocker flag, we put the container into the same network stack as the host, so that reading/proc/net/devfrom the file will produce the same result as the host (from host/ The file system mounted by procis not enough to read).
Note that some metrics are still different compared to the node exporter running directly on the host. Specifically, the reported metrics on file system usage will include the prefix in /rootfs in its mountpoint tag value because we are mounting in the root file system under this prefix in the container. There is no guarantee that the described workaround will be sufficient for any future Node Exporter functions, so you can decide to run Node Exporter on Docker.
The Prometheus server should now automatically start crawling the node exporter. Go to the status page of the http://your_server_ip:9090/statusPrometheus server and verify that the http://your_server_ip:9100/metrics target of the node job is now shown as HEALTHY status:
Step 3-Set up Grafana
Finally, we will form Grafana. Grafana is a graphical dashboard builder that supports Prometheus as the backend for querying data to graphs.
Grafana stores its dashboard metadata (such as which dashboards exist and the charts they should display) in a configurable SQL-based database. Grafana supports the use of SQLite3 databases supported by local files and external database servers such as MySQL or PostgreSQL.
In this tutorial, we will use the SQLite3 database backed by the Docker data volume.
Use your chosen administrator password (admin_password) to start Grafana as a Docker container:
docker run -d -p 3000:3000-e "GF_SECURITY_ADMIN_PASSWORD=admin_password"-v ~/grafana_db:/var/lib/grafana grafana/grafana
This will download the Grafana Docker image from Docker Hub and create a new Docker volume in the host system and the container file system in /var/lib/grafana in ~/grafana_db. In the container, Grafana will automatically create and initialize its SQLite3 database /var/lib/grafana/grafana.db.
The -e flag allows environment variables to be passed to processes started in the Docker container. Here, we use it to set the GF_SECURITY_ADMIN_PASSWORD environment variable to the desired dashboard administrator password, overriding the default password admin. Environment variables can also be used to override any other Grafana configuration settings. For details, please refer to Using Environment Variables
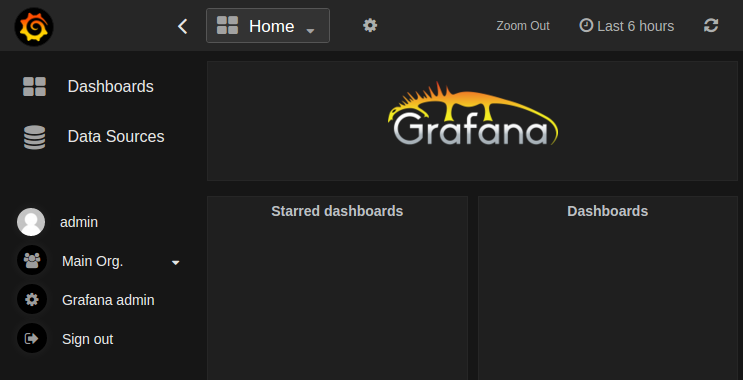
To verify that Grafana is working properly, go to http://your_server_ip:3000/. The admin username is admin, and the password is the password you chose when you started the Docker container.
After logging in, you should see Grafana's main view:
For more information on how to start using Grafana, please refer to Grafana Documentation. The Prometheus Grafana Document also explains how to use Prometheus specifically Grafana.
in conclusion
Congratulations! You have set up the Prometheus server, Node Exporter and Grafana-all of which use Docker. Although these are currently all running on the same machine, this is for demonstration purposes only. In a production setting, a node exporter, multiple Prometheus servers (according to the needs of the organization), and a single Grafana server are usually run on each monitored computer to map the data from these servers.
To learn more about the general use of Prometheus, please refer to its document.
For more Ubuntu tutorials, please go to [Tencent Cloud + Community] (https://cloud.tencent.com/developer?from=10680) to learn more.
Reference: "How To Install Prometheus using Docker on Ubuntu 14.04"
Recommended Posts