Python implements gradient descent method
The examples in this article share the specific code of python to implement the gradient descent method for your reference. The specific content is as follows
**Use tool: **Python(x,y) 2.6.6
**Operating environment: **Windows10
Problem: Solve y=2x1+x2+3, that is, use the gradient descent method to solve the optimal values of parameters a, b, c in y=ax1+b*x2+c (supervised learning)
**Training data: **
x_train=[1, 2], [2, 1],[2, 3], [3, 5], [1,3], [4, 2], [7, 3], [4, 5], [11, 3], [8, 7]
y_train=[7, 8, 10, 14, 8, 13, 20, 16, 28,26]
Test Data:
x_test = [1, 4],[2, 2],[2, 5],[5, 3],[1,5],[4, 1]
# - *- coding: utf-8-*-"""
Created on Wed Nov 1609:37:032016
@ author: Jason
"""

import numpy as np
import matplotlib.pyplot as plt

# y=2*(x1)+(x2)+3

rate =0.001
x_train = np.array([[1,2],[2,1],[2,3],[3,5],[1,3],[4,2],[7,3],[4,5],[11,3],[8,7]])
y_train = np.array([7,8,10,14,8,13,20,16,28,26])
x_test = np.array([[1,4],[2,2],[2,5],[5,3],[1,5],[4,1]])

a = np.random.normal()
b = np.random.normal()
c = np.random.normal()

def h(x):return a*x[0]+b*x[1]+c

for i inrange(100):
 sum_a=0
 sum_b=0
 sum_c=0for x, y inzip(x_train, y_train):for xi in x:
 sum_a = sum_a+ rate*(y-h(x))*xi
 sum_b = sum_b+ rate*(y-h(x))*xi
 # sum_c = sum_c + rate*(y-h(x))*1

 a = a + sum_a
 b = b + sum_b
 c = c + sum_c
 plt.plot([h(xi)for xi in x_test])print(a)print(b)print(c)

result=[h(xi)for xi in x_train]print(result)

result=[h(xi)for xi in x_test]print(result)

plt.show()
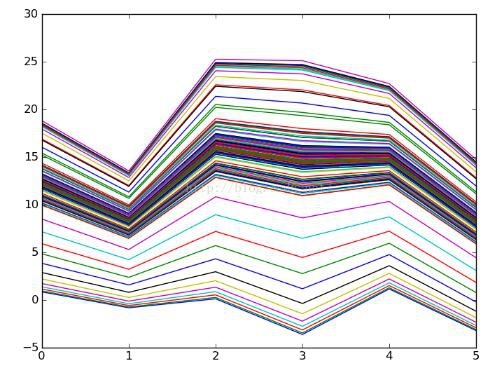
operation result:

**Conclusion: The ** line segment is gradually approaching. The more training data and the more iterations, the closer to the true value.
The above is the whole content of this article, I hope it will be helpful to everyone's study.
Recommended Posts