Python3.7 debugging example method
PyCharm IDE window layout

PyCharm debugging code example (here I take my own code as an example)
__ author__='lxm'
#! /usr/bin/python
importthread
importtime
# Defineafunctionforthethread
defprint_time(threadName,delay):
count=0
whilecount<5:
count+=1
print"%s:%s"%(threadName,time.ctime(time.time()))defcheck_sum(threadName,valueA,valueB):
print"tocalculatethesumoftwonumberher"
result=sum(valueA,valueB)
print"theresultis",result;defsum(valueA,valueB):
ifvalueA 0andvalueB 0:
returnvalueA+valueB
defreadFile(threadName,filename):
file=open(filename)
forlineinfile.xreadlines():
printline
try:
thread.start_new_thread(print_time,("Thread-1",2,))
thread.start_new_thread(check_sum,("Thread-2",4,5,))
thread.start_new_thread(readFile,("Thread-3","test.txt",))
except:
print"Error:unabletostartthread"
while1:
# print"end"
pass
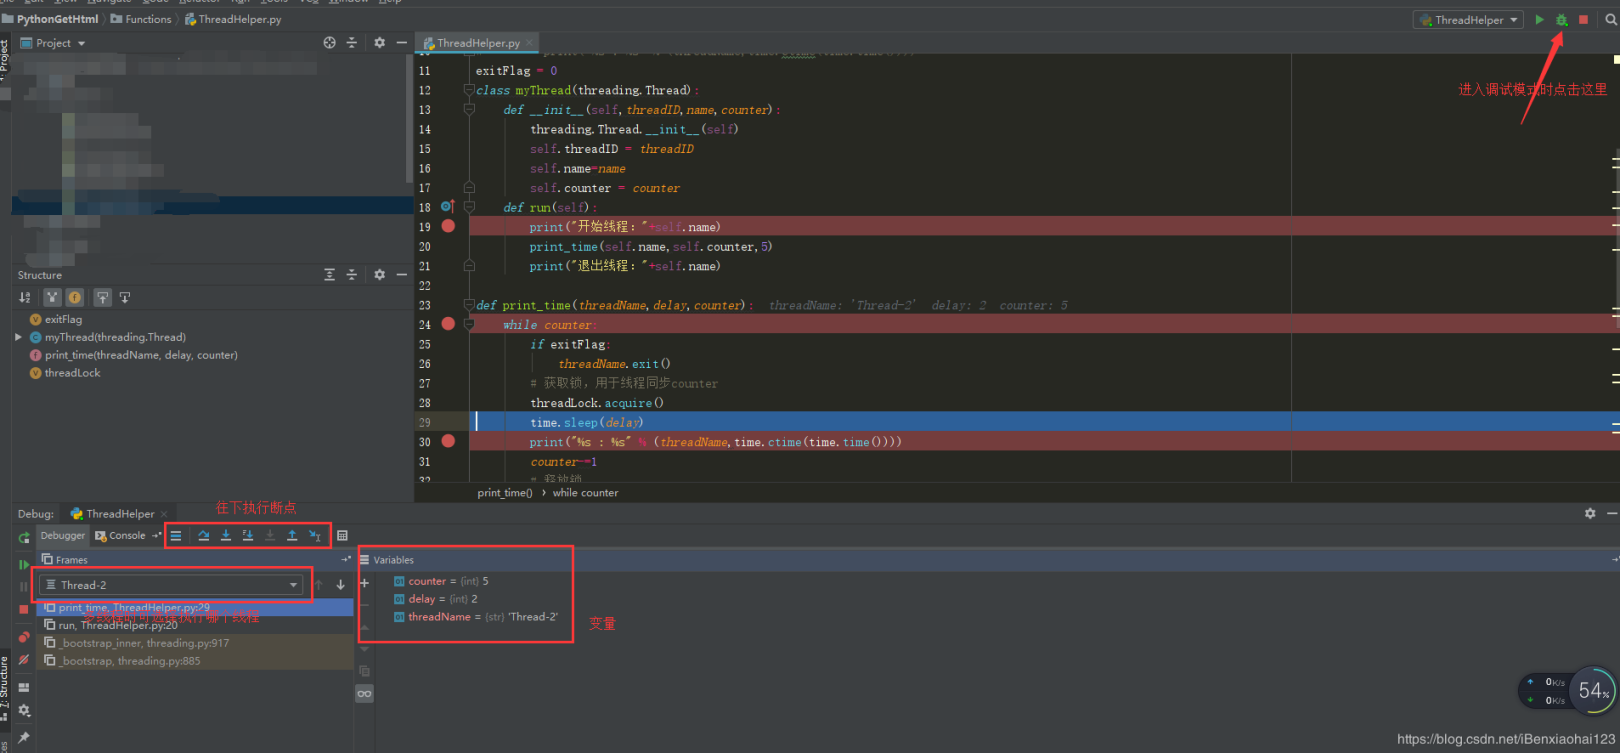
It is usually necessary to set breakpoints before debugging. Breakpoints can be set at loop or conditional judgment expressions or key points in the program. The method of setting a breakpoint is very simple: in the code edit box, move the cursor to the line where the breakpoint needs to be set, and then directly press Ctrl+F8 or select the menu "Run"-"Toggle Line Break Point", a more direct method is Double-click the left edge of the code editor, you can see the red dots appear. When debugging starts, the currently executing code will be directly displayed in blue. Three breakpoints are set in the figure below, and the code being executed is highlighted in blue.
Breakpoint setting
Expression evaluation: Sometimes it is necessary to track the value of some expressions to find problems in the program during debugging. Pycharm supports expression evaluation. You can select the expression and then select "Run"-"Evaluate Expression" , Directly select Evaluate in the window that appears to view it.
Pycharm also provides Variables and Watches windows, where the values of specific variables involved in the debugging steps can be viewed directly in the variable column.
Variable view
If you want to dynamically monitor a variable, you can directly select the variable and select the menu "Run"-"Add Watch" to add it to the watches column. When debugging goes to the statement where the variable is located, you can directly see the specific value of the variable in this window.
Knowledge point expansion:
For the debugging of python code, we usually use the debugging function that comes with the IDE. However, the debugging functions provided by the IDE have limitations, such as debugging code on the test server, but it is impossible to install the IDE on the test server for debugging. At this time, we can use the three tools explained below to debug.
Zero, ready to debug code
Before explaining the three debugging tools, we first write the code to be debugged. The code is very simple, just calculate the quotient of two numbers. When we wrote the code, we deliberately left a bug that divides by 0.
def division(start, end):for i inrange(start, end,-1):
 num1 = i
 num2 = i -1
 result = num1 / num2
 print(result)if __name__ =='__main__':division(10,0)
Recommended Posts