How to monitor CentOS 7 server with Prometheus
Introduction
Prometheus is an open source monitoring system developed by SoundCloud. Like other monitoring systems (such as InfluxDB and Graphite), Prometheus stores all of its data in a time series database. However, it provides a multi-dimensional data model and a powerful query language, so that system administrators can not only easily fine-tune the definition of their indicators, but also generate more accurate reports.
In addition, the Prometheus project also includes PromDash (a browser-based tool that can be used to develop custom dashboards) and an experimental AlertManager that can send alerts via email, Flowdock, Slack, HipChat, etc.
In this tutorial, you will learn how to install, configure and use Prometheus Server, Node Exporter and PromDash.
Preparation
To follow this tutorial, you need:
- A 64-bit CentOS 7 Tencent Cloud CVM
- To spoof a non-root user with sudo permissions, it is best to name it prometheus.
Students who don’t have a server can buy it from here, but I personally recommend you to use the free Tencent Cloud Developer Lab to experiment, and then buy server.
Step 1-Install Prometheus Server
First, create a new directory to store all the files you downloaded in this tutorial and move to that directory.
mkdir ~/Downloads
cd ~/Downloads
Use curl to download the latest version of Prometheus server and time series database from GitHub.
curl -LO "https://github.com/prometheus/prometheus/releases/download/0.16.0/prometheus-0.16.0.linux-amd64.tar.gz"
The Prometheus monitoring system consists of several components, and each component needs to be installed separately. It is a good idea to keep all components in a parent directory, so please use mkdir.
mkdir ~/Prometheus
Enter the directory you just created.
cd ~/Prometheus
Use tar to extract prometheus-0.16.0.linux-amd64.tar.gz.
tar -xvzf ~/Downloads/prometheus-0.16.0.linux-amd64.tar.gz
This completes the installation of the Prometheus server. Verify the installation by typing the following command:
~ /Prometheus/prometheus-0.16.0.linux-amd64/prometheus -version
You should see the following message on the screen:
prometheus, version 0.16.0(branch: HEAD, revision: dcb8ba4)
 build user:       julius@desktop
 build date:20151009-23:51:17
 go version:1.5.1
Step 2-Install Node Exporter
Prometheus was developed for monitoring web services. In order to monitor the metrics of the CentOS server, you should install a tool called Node Exporter. The node exporter, as the name suggests, exports a large number of metrics (such as disk I/O statistics, CPU load, memory usage, network statistics, etc.) in a format that Prometheus understands.
Enter the Downloads directory and use curl to download the latest version of Node Exporter available on GitHub.
cd ~/Downloads && curl -LO "https://github.com/prometheus/node_exporter/releases/download/0.11.0/node_exporter-0.11.0.linux-amd64.tar.gz"
Create a new directory named node_exporter in the Prometheus directory and enter the directory:
mkdir ~/Prometheus/node_exporter
cd ~/Prometheus/node_exporter
You can now use the tar command to extract node_exporter-0.11.0.linux-amd64.tar.gz.
tar -xvzf ~/Downloads/node_exporter-0.11.0.linux-amd64.tar.gz
Step 3-Run the node exporter as a service
To make it easier to start and stop the node exporter, let us now convert it to a service.
Use vi or any other text editor to create a unit configuration file named node_exporter.service.
sudo vi /etc/systemd/system/node_exporter.service
This file should contain the path of the node_exporter executable file and specify the user who should run the executable file. Therefore, add the following code:
[ Unit]
Description=Node Exporter
[ Service]
User=prometheus
ExecStart=/home/prometheus/Prometheus/node_exporter/node_exporter
[ Install]
WantedBy=default.target
Save the file and exit the text editor.
Reload systemd so that it can read the configuration file you just created.
sudo systemctl daemon-reload
At this time, the node exporter can be used as a service that can be managed using the systemctl command. Enable it so that it starts automatically at boot time.
sudo systemctl enable node_exporter.service
You can restart the server now, or you can manually start the service using the following command:
sudo systemctl start node_exporter.service
After startup, use a browser to view the Web interface of Node Exporter, which is located at http://your_server_ip:9100/metrics. You should see a page with a lot of text:
# HELP go_gc_duration_seconds A summary of the GC invocation durations.
# TYPE go_gc_duration_seconds summary
go_gc_duration_seconds{quantile="0"}0.00023853100000000002
go_gc_duration_seconds{quantile="0.25"}0.00023998700000000002
go_gc_duration_seconds{quantile="0.5"}0.00028122...
Step 4-Start Prometheus server
Enter the directory where the Prometheus server is installed:
cd ~/Prometheus/prometheus-0.16.0.linux-amd64
Before starting Prometheus, you must first create a configuration file named prometheus.yml for it.
vi ~/Prometheus/prometheus-0.16.0.linux-amd64/prometheus.yml
Copy the following code into the file.
scrape_configs:- job_name:"node"
 scrape_interval:"15s"
 target_groups:- targets:['localhost:9100']
This will create a scrape_configs section and define a job called node. It contains the URL of the Node Exporter's web interface in the targets array. To make the prometheus scrape indicator every fifteen seconds, the scrape_interval will be set to 15 seconds.
You can name your work as you want, but you can use Node Exporter's default console template by naming it "node".
Save the file and exit.
Start the Prometheus server as a background process.
nohup ./prometheus > prometheus.log 2>&1&
Note that you redirected the output of the Prometheus server to a file named prometheus.log. You can use the tail command to view the last few lines of the file:
tail ~/Prometheus/prometheus-0.16.0.linux-amd64/prometheus.log
When the server is ready, you will see the following message in the file:
INFO[0000] Starting target manager...         file=targetmanager.go line=75
INFO[0000] Listening on :9090                 file=web.go line=118
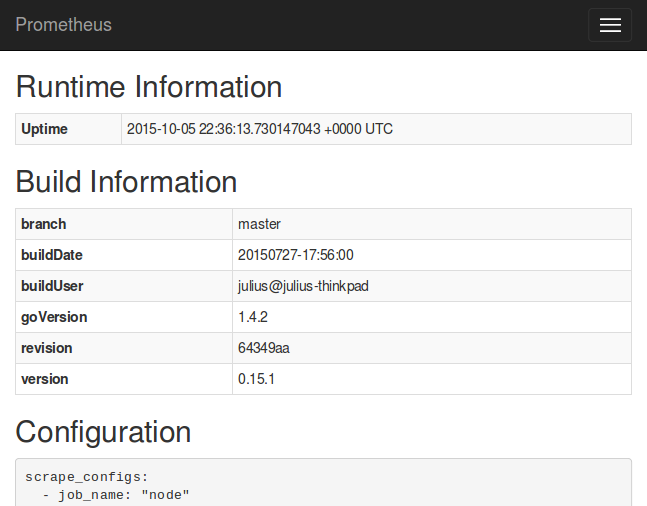
Use a browser to visit the homepage of Prometheus on http://your_server_ip:9090. You will see the following homepage.
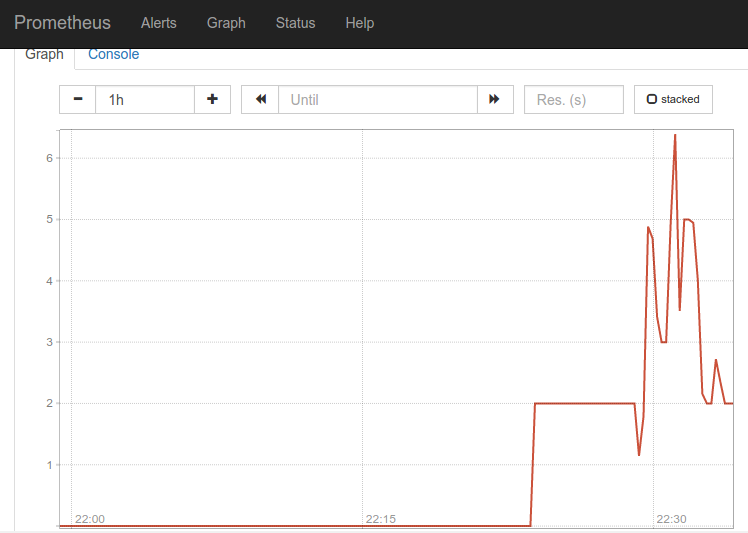
To ensure that Prometheus grabs data from Node Exporter, click the Graph tab at the top of the page. On the page that opens, type the name of the metric (for example, nodeprocsrunning) in the text field representing Expression. Then, press the blue Execute button. Click the chart below (next to the console), and you should see a chart of the indicator:
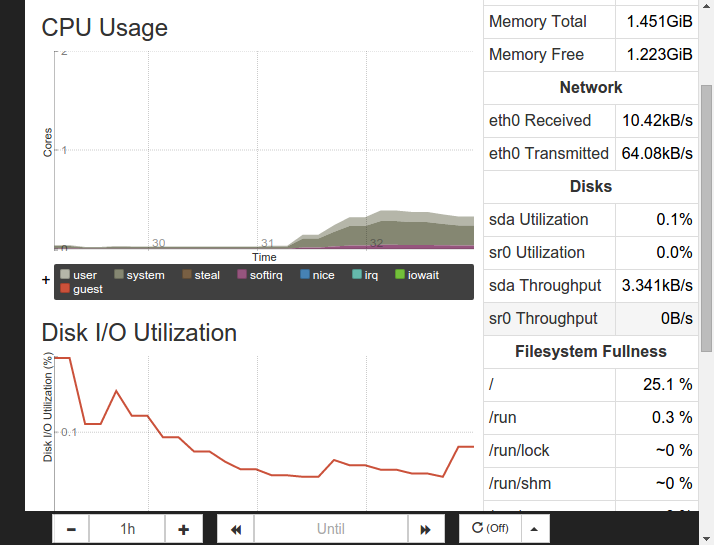
Prometheus has a console template that can be used to view graphs of some commonly used indicators. These console templates can only be accessed when the value of job_name is set to node in the Prometheus configuration.
Visit http://your_server_ip:9090/consoles/node.html to access the node console and click on your server localhost:9100 to view its metrics:
Step 5-Install PromDash
Although the Prometheus server allows you to view graphs and experiment with expressions, it is usually only used for debugging purposes or to run one-off queries. The preferred way to visualize data in Prometheus' time series database is to use PromDash, a tool that allows you to create custom dashboards that are not only highly configurable, but also more aesthetically pleasing.
Enter the Prometheus directory:
cd ~/Prometheus
PromDash is a Ruby on Rails application whose source files are available on GitHub. To download and run it, you need to install Git, Ruby and some build tools. Use yum to do so.
sudo yum install git ruby ruby-devel sqlite-devel zlib-devel gcc gcc-c++ automake patch
You can now download the source file using the git command.
git clone https://github.com/prometheus/promdash.git
Enter the promdash directory.
cd ~/Prometheus/promdash
PromDash depends on several Ruby gems. In order to install these gems automatically, you should install a gem called bundler.
gem install bundler
You can now use the bundle command to install all the Ruby gems required by PromDash. Since we will configure PromDash to use SQLite3 in this tutorial, make sure to exclude MySQL and PostgreSQL gems using the --without parameter:
bundle install --without mysql postgresql
You may need to wait a few minutes to complete this command. When finished, you should see the following message:
...
Your bundle is complete!
Gems in the groups mysql and postgresql were not installed.
Use `bundle show [gemname]` to see where a bundled gem is installed.
Step 6-Set up the Rails environment
Create a directory to store the SQLite3 database associated with PromDash.
mkdir ~/Prometheus/databases
PromDash uses an environment variable named DATABASE_URL to determine the name of the database associated with it. Type the following so that PromDash creates a SQLite3 database named mydb.sqlite3 in the databases directory:
echo "export DATABASE_URL=sqlite3:$HOME/Prometheus/databases/mydb.sqlite3">>~/.bashrc
In this tutorial, you will run PromDash in production mode, so set the RAILS_ENV environment variable to production.
echo "export RAILS_ENV=production">>~/.bashrc
Apply the changes we made to the .bashrc file.
.~ /.bashrc
Next, use the rake tool to create a PromDash table in the SQLite3 database.
rake db:migrate
Because PromDash uses the Rails asset pipeline, all assets (CSS files, images, and Javascript files) of the PromDash project should be pre-compiled. Just enter the following:
rake assets:precompile
Step 7-Start and configure PromDash
PromDash runs on a thin, lightweight web server. Start the server as a daemon by typing the following command:
bundle exec thin start -d
Wait a few seconds for the server to start, and then visit http://your_server_ip:3000/ to view the homepage of PromDash.
Before you start creating a custom dashboard, you should let PromDash know the URL of your Prometheus server. You can do this by clicking on the "Server" tab at the top. Click "New Server", and in the form, specify any name for the Prometheus server. Set the Url field to http://your_server_ip:9090, and set the Server type field to Prometheus.
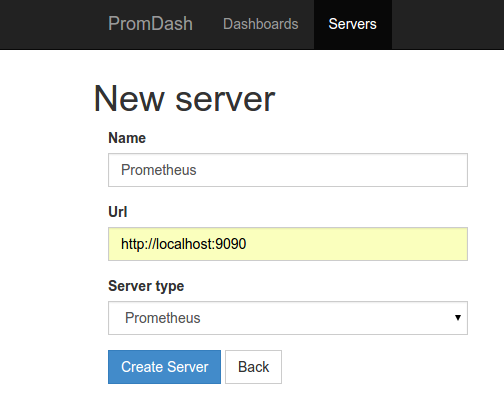
Finally, click "Create Server" to complete the configuration. Your page will say **The server has been successfully created. **You can click back to Dashboard in the top menu.
Step 8-Create Dashboard
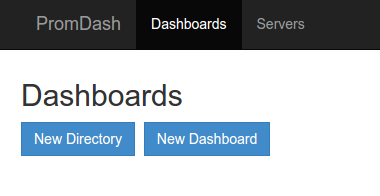
Because the Promdash dashboard should belong to the Promdash directory, first create a new directory by clicking New Directory. In the displayed form, name your directory, for example My Dashboards, and click Create Directory.
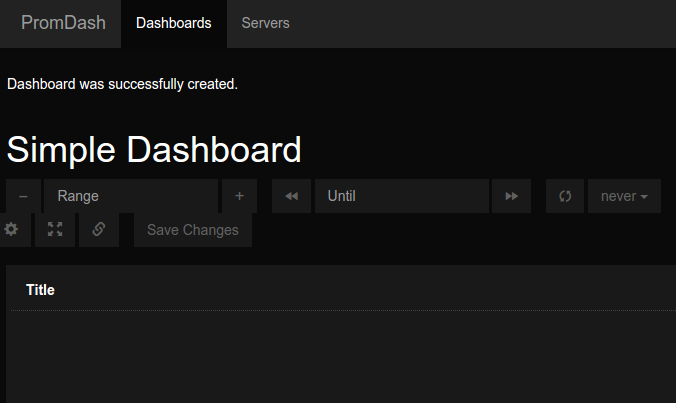
After submitting the form, you will be taken back to the home page. Click the "New Dashboard" button now to create a new dashboard. In the displayed form, name the dashboard, such as Simple Dashboard, and select the directory you just created from the drop-down menu.
After submitting the form, you will be able to see the new dashboard.
Your dashboard already has a chart, but it needs to be configured. Hovering the mouse over the title of the chart (i.e. Title) will display various icons that allow you to configure the chart. To change its title, you can click the "Graph and Axis Settings" icon (fourth from the left), and then type a new title in the "Graph Title" field.
Click the Data Source icon (second from the left) to add one or more expressions to the graph. Click "Add expression", and enter node procs running in the "Enter expression" field.

Now click on the Refresh icon (the leftmost one) in the chart title to update the graph. Your dashboard now contains a fully configured chart. You can add more charts by clicking the "Add Chart" button at the bottom.
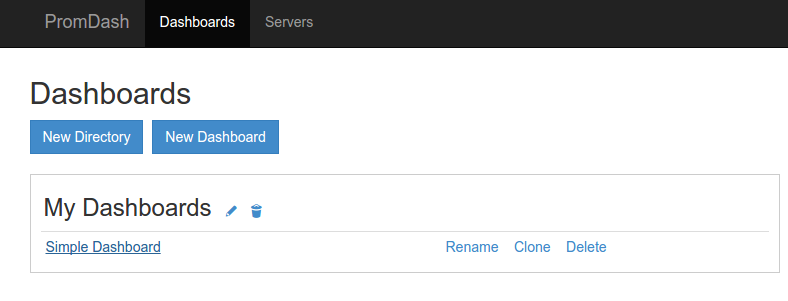
After making all the changes, make sure to click the "Save Changes" button on the right to make the changes permanent. The next time you visit PromDash's homepage, you will be able to see a link to the dashboard:
in conclusion
You now have a fully functional Prometheus ecosystem running on a CentOS 7 server, and you can use PromDash to create a monitoring dashboard that suits your needs.
Even if you install all the components on a single CentOS computer, you can easily install only the node exporter on each computer, and add the URL of the new node exporter to the targets in the prometheus.yml array Monitor more computers.
You can refer to its document for more information about Prometheus.
To learn more about using Prometheus to monitor CentOS 7 server related tutorials, please go to [Tencent Cloud + Community] (https://cloud.tencent.com/developer?from=10680) to learn more.
Reference: "How to Use Prometheus to Monitor Your CentOS 7 Server"
Recommended Posts