Pythonは平均シフトクラスタリングアルゴリズムを実装しています
この記事の例では、参照用に平均シフトクラスタリングアルゴリズムを実装するためのpythonの特定のコードを共有しています。具体的な内容は次のとおりです。
1、 新しいMeanShift.pyファイルを作成します
import numpy as np

# 事前設定されたしきい値を定義する
STOP_THRESHOLD =1e-4
CLUSTER_THRESHOLD =1e-1

# 測定機能を定義する
def distance(a, b):return np.linalg.norm(np.array(a)- np.array(b))

# ガウスカーネル関数を定義する
def gaussian_kernel(distance, bandwidth):return(1/(bandwidth * np.sqrt(2* np.pi)))* np.exp(-0.5*((distance / bandwidth))**2)

# mean_シフトクラス
classmean_shift(object):
 def __init__(self, kernel=gaussian_kernel):
 self.kernel = kernel

 def fit(self, points, kernel_bandwidth):

 shift_points = np.array(points)
 shifting =[True]* points.shape[0]while True:
 max_dist =0for i inrange(0,len(shift_points)):if not shifting[i]:continue
 p_shift_init = shift_points[i].copy()
 shift_points[i]= self._shift_point(shift_points[i], points, kernel_bandwidth)
 dist =distance(shift_points[i], p_shift_init)
 max_dist =max(max_dist, dist)
 shifting[i]= dist   STOP_THRESHOLD

 if(max_dist < STOP_THRESHOLD):break
 cluster_ids = self._cluster_points(shift_points.tolist())return shift_points, cluster_ids

 def _shift_point(self, point, points, kernel_bandwidth):
 shift_x =0.0
 shift_y =0.0
 scale =0.0for p in points:
 dist =distance(point, p)
 weight = self.kernel(dist, kernel_bandwidth)
 shift_x += p[0]* weight
 shift_y += p[1]* weight
 scale += weight
 shift_x = shift_x / scale
 shift_y = shift_y / scale
 return[shift_x, shift_y]

 def _cluster_points(self, points):
 cluster_ids =[]
 cluster_idx =0
 cluster_centers =[]for i, point inenumerate(points):if(len(cluster_ids)==0):
 cluster_ids.append(cluster_idx)
 cluster_centers.append(point)
 cluster_idx +=1else:for center in cluster_centers:
  dist =distance(point, center)if(dist < CLUSTER_THRESHOLD):
  cluster_ids.append(cluster_centers.index(center))if(len(cluster_ids)< i +1):
  cluster_ids.append(cluster_idx)
  cluster_centers.append(point)
  cluster_idx +=1return cluster_ids
2、 上記のpyファイルを呼び出す
# - *- coding: utf-8-*-"""
Created on Tue Oct 0911:02:082018

@ author: muli
"""

from sklearn.datasets.samples_generator import make_blobs
import matplotlib.pyplot as plt
import random
import numpy as np
import MeanShift

def colors(n):
 ret =[]for i inrange(n):
 ret.append((random.uniform(0,1), random.uniform(0,1), random.uniform(0,1)))return ret

def main():
 centers =[[-1,-1],[-1,1],[1,-1],[1,1]]
 X, _ =make_blobs(n_samples=300, centers=centers, cluster_std=0.4)

 mean_shifter = MeanShift.mean_shift()
 _, mean_shift_result = mean_shifter.fit(X, kernel_bandwidth=0.5)

 np.set_printoptions(precision=3)print('input: {}'.format(X))print('assined clusters: {}'.format(mean_shift_result))
 color =colors(np.unique(mean_shift_result).size)for i inrange(len(mean_shift_result)):
 plt.scatter(X[i,0], X[i,1], color = color[mean_shift_result[i]])
 plt.show()if __name__ =='__main__':main()
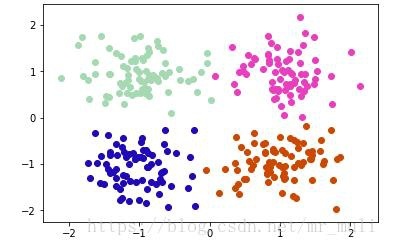
結果を図に示します。

参照リンク
以上が本稿の内容ですので、皆様のご勉強に役立てていただければ幸いです。
Recommended Posts